Pier 1 2010 Annual Report Download - page 23
Download and view the complete annual report
Please find page 23 of the 2010 Pier 1 annual report below. You can navigate through the pages in the report by either clicking on the pages listed below, or by using the keyword search tool below to find specific information within the annual report.-
 1
1 -
2
-
3
-
4
-
5
-
6
-
7
-
8
-
9
-
10
-
11
-
12
-
 13
13 -
 14
14 -
 15
15 -
 16
16 -
 17
17 -
 18
18 -
 19
19 -
 20
20 -
 21
21 -
 22
22 -
 23
23 -
 24
24 -
 25
25 -
 26
26 -
 27
27 -
 28
28 -
 29
29 -
 30
30 -
 31
31 -
 32
32 -
 33
33 -
34
-
35
-
36
-
37
-
38
-
39
-
40
-
41
-
42
-
43
-
44
-
45
-
46
-
47
-
48
-
49
-
50
-
51
-
52
-
53
-
54
-
55
-
56
-
57
-
58
-
59
-
60
-
61
-
62
-
63
-
64
-
65
-
66
-
67
-
68
-
69
-
70
-
71
-
72
-
73
-
74
-
75
-
76
-
77
-
78
-
79
-
80
-
81
-
82
-
83
-
84
-
85
-
86
-
87
-
88
-
89
-
90
-
91
-
92
-
93
-
94
-
95
-
96
-
97
-
98
-
99
-
100
-
101
-
102
-
103
-
104
-
105
-
106
-
107
-
108
-
109
-
110
-
111
-
112
-
113
-
114
-
115
-
116
-
117
-
118
-
119
-
120
-
121
-
122
-
123
-
124
-
125
-
126
-
127
-
128
-
129
-
130
-
131
-
132
-
133
-
134
-
135
-
136
-
137
-
138
-
139
-
140
-
141
-
142
-
143
-
144
-
145
-
146
-
147
-
148
 |
 |
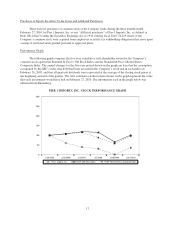
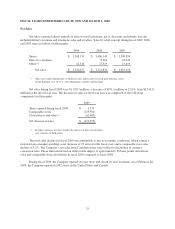
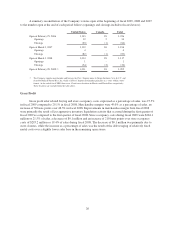
Purchases of Equity Securities by the Issuer and Affiliated Purchasers
There were no purchases of common stock of the Company made during the three months ended
February 27, 2010, by Pier 1 Imports, Inc. or any “affiliated purchaser” of Pier 1 Imports, Inc. as defined in
Rule 10b-18(a)(3) under the Securities Exchange Act of 1934. During fiscal 2010, 54,219 shares of the
Company’s common stock were acquired from employees to satisfy tax withholding obligations that arose upon
vesting of restricted stock granted pursuant to approved plans.
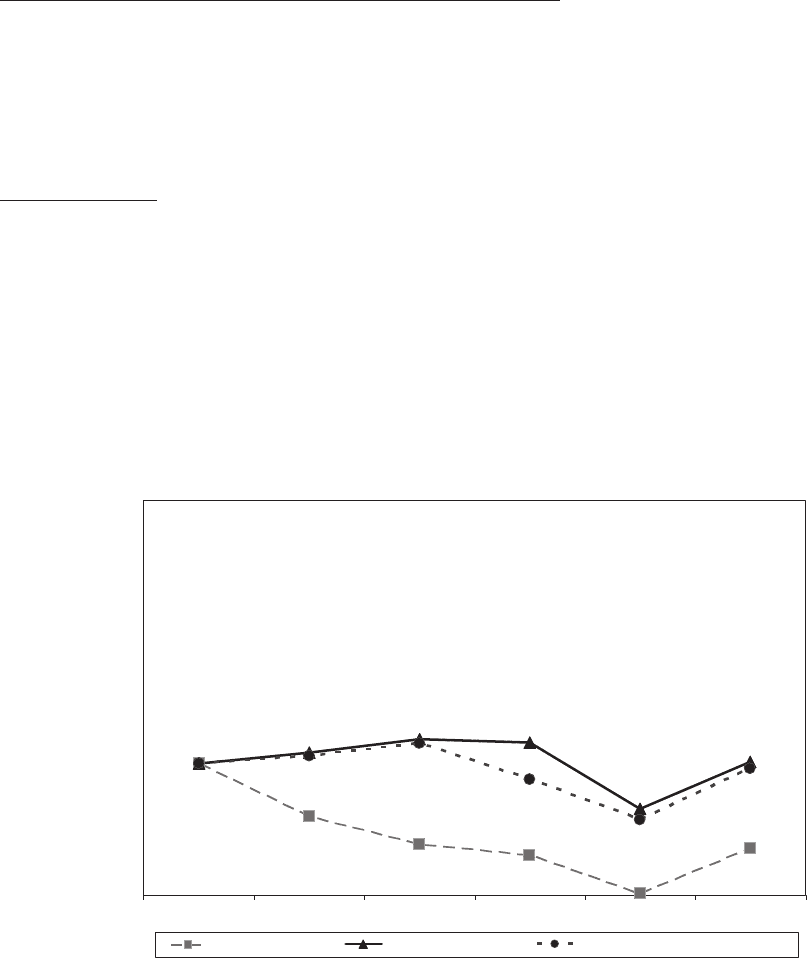
Performance Graph
The following graph compares the five-year cumulative total shareholder return for the Company’s
common stock against the Standard & Poor’s 500 Stock Index and the Standard & Poor’s Retail Stores
Composite Index. The annual changes for the five-year period shown on the graph are based on the assumption,
as required by the SEC’s rules, that $100 had been invested in the Company’s stock and in each index on
February 26, 2005, and that all quarterly dividends were reinvested at the average of the closing stock prices at
the beginning and end of the quarter. The total cumulative dollar returns shown on the graph represent the value
that such investments would have had on February 27, 2010. The information used in the graph below was
obtained from Bloomberg.
PIER 1 IMPORTS, INC. STOCK PERFORMANCE GRAPH
0
50
100
150
200
250
300
2/26/2005 2/25/2006 3/3/2007 3/1/2008 2/28/2009 2/27/2010
Pier 1 Imports, Inc. S&P 500 Stock Index S&P Retail Stores Composite Index
17