Pier 1 2010 Annual Report Download - page 24
Download and view the complete annual report
Please find page 24 of the 2010 Pier 1 annual report below. You can navigate through the pages in the report by either clicking on the pages listed below, or by using the keyword search tool below to find specific information within the annual report.-
 1
1 -
2
-
3
-
4
-
5
-
6
-
7
-
8
-
9
-
10
-
11
-
12
-
13
-
 14
14 -
 15
15 -
 16
16 -
 17
17 -
 18
18 -
 19
19 -
 20
20 -
 21
21 -
 22
22 -
 23
23 -
 24
24 -
 25
25 -
 26
26 -
 27
27 -
 28
28 -
 29
29 -
 30
30 -
 31
31 -
 32
32 -
 33
33 -
 34
34 -
35
-
36
-
37
-
38
-
39
-
40
-
41
-
42
-
43
-
44
-
45
-
46
-
47
-
48
-
49
-
50
-
51
-
52
-
53
-
54
-
55
-
56
-
57
-
58
-
59
-
60
-
61
-
62
-
63
-
64
-
65
-
66
-
67
-
68
-
69
-
70
-
71
-
72
-
73
-
74
-
75
-
76
-
77
-
78
-
79
-
80
-
81
-
82
-
83
-
84
-
85
-
86
-
87
-
88
-
89
-
90
-
91
-
92
-
93
-
94
-
95
-
96
-
97
-
98
-
99
-
100
-
101
-
102
-
103
-
104
-
105
-
106
-
107
-
108
-
109
-
110
-
111
-
112
-
113
-
114
-
115
-
116
-
117
-
118
-
119
-
120
-
121
-
122
-
123
-
124
-
125
-
126
-
127
-
128
-
129
-
130
-
131
-
132
-
133
-
134
-
135
-
136
-
137
-
138
-
139
-
140
-
141
-
142
-
143
-
144
-
145
-
146
-
147
-
148
 |
 |

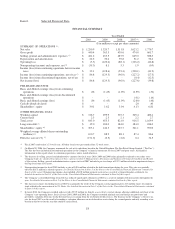
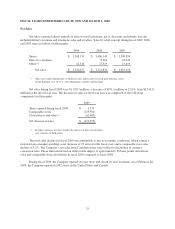
Item 6. Selected Financial Data.
FINANCIAL SUMMARY
Year Ended
2010 2009 2008 2007 (1) 2006
($ in millions except per share amounts)
SUMMARY OF OPERATIONS (2):
Net sales $ 1,290.9 1,320.7 1,511.8 1,623.2 1,776.7
Gross profit $ 440.4 363.5 439.6 474.0 601.7
Selling, general and administrative expenses (3) $ 421.2 453.5 487.9 649.0 588.3
Depreciation and amortization $ 22.5 30.6 39.8 51.2 56.2
Operating loss $ (3.3) (120.6) (88.1) (226.2) (42.8)
Nonoperating (income) and expenses, net (4) $ (35.3) 8.1 5.3 1.9 (0.9)
Income (loss) from continuing operations before income
taxes $ 32.1 (128.6) (93.4) (228.1) (41.9)
Income (loss) from continuing operations, net of tax (7) $ 86.8 (129.3) (96.0) (227.2) (27.5)
Income (loss) from discontinued operations, net of tax $ - - - (0.4) (12.3)
Net income (loss) $ 86.8 (129.3) (96.0) (227.6) (39.8)
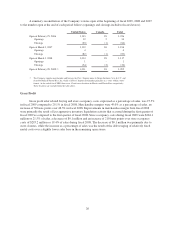
PER SHARE AMOUNTS:
Basic and diluted earnings (loss) from continuing
operations $ .86 (1.45) (1.09) (2.59) (.32)
Basic and diluted earnings (loss) from discontinued
operations $ - - - (.01) (.14)
Basic and diluted earnings (loss) $ .86 (1.45) (1.09) (2.60) (.46)
Cash dividends declared $ - - - .20 .40
Shareholders’ equity $ 3.01 1.62 3.04 4.13 6.81
OTHER FINANCIAL DATA:
Working capital $ 316.7 299.9 307.3 349.4 486.1
Current ratio 2.3 2.3 2.1 2.2 2.7
Total assets $ 643.0 655.5 821.9 916.5 1,169.9
Long-term debt (5) $ 19.0 184.0 184.0 184.0 184.0
Shareholders’ equity (6) $ 303.1 144.3 267.7 361.1 590.0
Weighted average diluted shares outstanding
(millions) (6) 100.7 88.9 88.1 87.4 86.6
Effective tax rate (%) (7) (171.0) (0.5) (2.8) 0.4 34.5
(1) Fiscal 2007 consisted of a 53-week year. All other fiscal years presented reflect 52-week years.
(2) On March 20, 2006, the Company announced the sale of its subsidiary based in the United Kingdom, The Pier Retail Group Limited (“The Pier”).
The Pier has been included in discontinued operations in the Company’s financial statements for fiscal 2007 and prior years. All financial
information in this report relates to continuing operations, unless stated otherwise.
(3) The decrease in selling, general and adminstrative expenses for fiscal years 2010, 2009 and 2008 relate primarily to initiatives to reduce costs
Company-wide. See detailed description of these expenses in Item 7. Management’s Discussion and Analysis of Financial Condition and Results
of Operations. Selling, general and administrative expense in fiscal 2007 included a pre-tax charge of $32.3 million related to impairment charges
on long-lived store level assets.
(4) Nonoperating income for fiscal 2010 includes a gain of $49.6 million related to the debt transactions during the year. This gain was paritally
offset by $18.3 million in related expenses. See detailed discussion in Note 5 of the Notes to the Consolidated Financial Statements contained in
Item 8 of this report. Nonoperating income also included a $10.0 million payment received as a result of a foreign litigation settlement. See
detailed discussion in Note 11 of the Notes to the Consolidated Financial Statements contained in Item 8 of this report.
(5) The Company’s consolidated long-term debt was reduced significantly during fiscal 2010 as a result of mulitple debt transactions throughout the
year. See detailed discussion in Note 5 of the Notes to the Consolidated Financial Statements contained in Item 8 of this report.
(6) The increase in shares oustanding in fiscal 2010 was primarily the result of the Company issuing approximately 24.5 million shares of common
stock related to the conversion of its 9% Notes. See detailed discussion in Note 5 of the Notes to the Consolidated Financial Statements contained
in Item 8 of this report.
(7) In fiscal 2010, the Company recorded and received a $55.9 million tax benefit as a result of a tax law change allowing additional carryback of the
Company’s net operating losses. In fiscal years 2010, 2009 and 2008, the Company recorded minimal state and foreign tax provisions and
provided a valuation allowance on the deferred tax asset arising from the tax benefit of those losses. The decrease in the Company’s effective tax
rate for fiscal 2007 was the result of recording a valuation allowance on its deferred tax assets during the second quarter and only recording a tax
benefit on the losses for the year that could be carried back.
18