Pier 1 2010 Annual Report Download - page 32
Download and view the complete annual report
Please find page 32 of the 2010 Pier 1 annual report below. You can navigate through the pages in the report by either clicking on the pages listed below, or by using the keyword search tool below to find specific information within the annual report.-
 1
1 -
2
-
3
-
4
-
5
-
6
-
7
-
8
-
9
-
10
-
11
-
12
-
13
-
14
-
15
-
16
-
17
-
18
-
19
-
20
-
21
-
 22
22 -
 23
23 -
 24
24 -
 25
25 -
 26
26 -
 27
27 -
 28
28 -
 29
29 -
 30
30 -
 31
31 -
 32
32 -
 33
33 -
 34
34 -
 35
35 -
 36
36 -
 37
37 -
 38
38 -
 39
39 -
 40
40 -
 41
41 -
 42
42 -
43
-
44
-
45
-
46
-
47
-
48
-
49
-
50
-
51
-
52
-
53
-
54
-
55
-
56
-
57
-
58
-
59
-
60
-
61
-
62
-
63
-
64
-
65
-
66
-
67
-
68
-
69
-
70
-
71
-
72
-
73
-
74
-
75
-
76
-
77
-
78
-
79
-
80
-
81
-
82
-
83
-
84
-
85
-
86
-
87
-
88
-
89
-
90
-
91
-
92
-
93
-
94
-
95
-
96
-
97
-
98
-
99
-
100
-
101
-
102
-
103
-
104
-
105
-
106
-
107
-
108
-
109
-
110
-
111
-
112
-
113
-
114
-
115
-
116
-
117
-
118
-
119
-
120
-
121
-
122
-
123
-
124
-
125
-
126
-
127
-
128
-
129
-
130
-
131
-
132
-
133
-
134
-
135
-
136
-
137
-
138
-
139
-
140
-
141
-
142
-
143
-
144
-
145
-
146
-
147
-
148
 |
 |

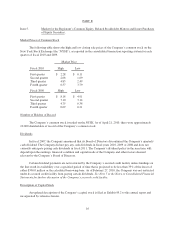
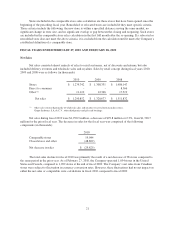
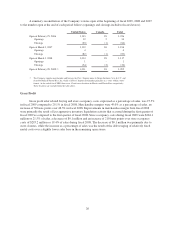
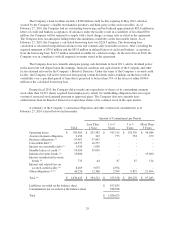
A summary reconciliation of the Company’s stores open at the beginning of fiscal 2009, 2008 and 2007
to the number open at the end of each period follows (openings and closings include relocated stores):
United States Canada Total
Open at February 25, 2006 1,143 83 1,226
Openings 32 2 34
Closings (63) (1) (64)
Open at March 3, 2007 1,112 84 1,196
Openings 4 - 4
Closings (82) (1) (83)
Open at March 1, 2008 1,034 83 1,117
Openings 1 - 1
Closings (24) (2) (26)
Open at February 28, 2009 (1) 1,011 81 1,092
(1) The Company supplies merchandise and licenses the Pier 1 Imports name to Grupo Sanborns, S.A. de C.V. and
Sears Roebuck de Puerto Rico, Inc. which sell Pier 1 Imports merchandise primarily in a “store within a store”
format. At the end of fiscal 2009, there were 35 and seven locations in Mexico and Puerto Rico, respectively.
These locations are excluded from the table above.
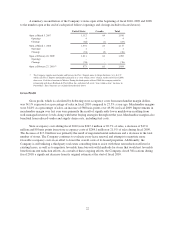
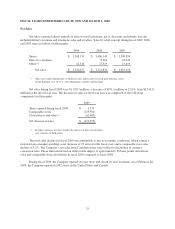
Gross Profit
Gross profit after related buying and store occupancy costs, expressed as a percentage of sales, was 27.5%
in fiscal 2009 compared to 29.1% in fiscal 2008. Merchandise margins were 49.0% as a percentage of sales, an
increase of 50 basis points over 48.5% in fiscal 2008. Improvements in merchandise margin from fiscal 2008
were primarily the result of less aggressive inventory liquidation activity that occurred during the first quarter of
fiscal 2009 as compared to the first quarter of fiscal 2008. Store occupancy costs during fiscal 2009 were $284.1
million or 21.5% of sales, a decrease of $9.1 million and an increase of 210 basis points over store occupancy
costs of $293.2 million or 19.4% of sales during fiscal 2008. The decrease of $9.1 million was primarily due to
store closures, while the increase as a percentage of sales was the result of the deleveraging of relatively fixed
rental costs over a slightly lower sales base in the remaining open stores.
26