Pier 1 2010 Annual Report Download - page 63
Download and view the complete annual report
Please find page 63 of the 2010 Pier 1 annual report below. You can navigate through the pages in the report by either clicking on the pages listed below, or by using the keyword search tool below to find specific information within the annual report.-
 1
1 -
2
-
3
-
4
-
5
-
6
-
7
-
8
-
9
-
10
-
11
-
12
-
13
-
14
-
15
-
16
-
17
-
18
-
19
-
20
-
21
-
22
-
23
-
24
-
25
-
26
-
27
-
28
-
29
-
30
-
31
-
32
-
33
-
34
-
35
-
36
-
37
-
38
-
39
-
40
-
41
-
42
-
43
-
44
-
45
-
46
-
47
-
48
-
49
-
50
-
51
-
52
-
 53
53 -
 54
54 -
 55
55 -
 56
56 -
 57
57 -
 58
58 -
 59
59 -
 60
60 -
 61
61 -
 62
62 -
 63
63 -
 64
64 -
 65
65 -
 66
66 -
 67
67 -
 68
68 -
 69
69 -
 70
70 -
 71
71 -
 72
72 -
 73
73 -
74
-
75
-
76
-
77
-
78
-
79
-
80
-
81
-
82
-
83
-
84
-
85
-
86
-
87
-
88
-
89
-
90
-
91
-
92
-
93
-
94
-
95
-
96
-
97
-
98
-
99
-
100
-
101
-
102
-
103
-
104
-
105
-
106
-
107
-
108
-
109
-
110
-
111
-
112
-
113
-
114
-
115
-
116
-
117
-
118
-
119
-
120
-
121
-
122
-
123
-
124
-
125
-
126
-
127
-
128
-
129
-
130
-
131
-
132
-
133
-
134
-
135
-
136
-
137
-
138
-
139
-
140
-
141
-
142
-
143
-
144
-
145
-
146
-
147
-
148
 |
 |

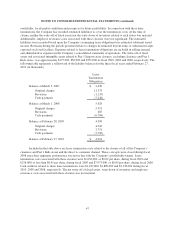
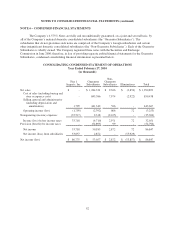
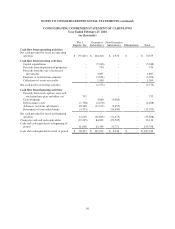
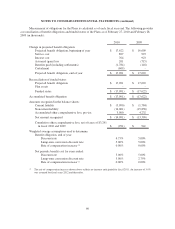
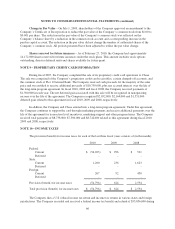
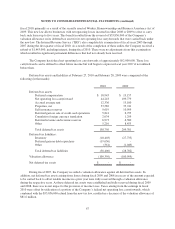
NOTES TO CONSOLIDATED FINANCIAL STATEMENTS (continued)
CONSOLIDATING CONDENSED STATEMENT OF CASH FLOWS
Year Ended February 28, 2009
(in thousands)
Pier 1
Imports, Inc.
Guarantor
Subsidiaries
Non-Guarantor
Subsidiaries Eliminations Total
Cash flow from operating activities:
Net cash provided by (used in) operating
activities $ 4,782 $ (55,282) $ 18,866 $ - $ (31,634)
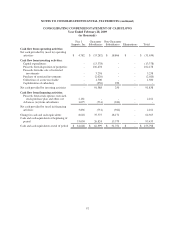
Cash flow from investing activities:
Capital expenditures - (13,378) - - (13,378)
Proceeds from disposition of properties - 102,478 - - 102,478
Proceeds from the sale of restricted
investments - 3,258 - - 3,258
Purchase of restricted investments - (2,020) - - (2,020)
Collections of a note receivable - 1,500 - - 1,500
Capitalization of subsidiary - (250) 250 - -
Net cash provided by investing activities - 91,588 250 - 91,838
Cash flow from financing activities:
Proceeds from stock options exercised,
stock purchase plan and other, net 2,161 - - - 2,161
Advances (to) from subsidiaries 1,675 (731) (944) - -
Net cash provided by (used in) financing
activities 3,836 (731) (944) - 2,161
Change in cash and cash equivalents 8,618 35,575 18,172 - 62,365
Cash and cash equivalents at beginning of
period 53,030 26,824 13,579 - 93,433
Cash and cash equivalents at end of period $ 61,648 $ 62,399 $ 31,751 $ - $ 155,798
57