Pier 1 2010 Annual Report Download - page 60
Download and view the complete annual report
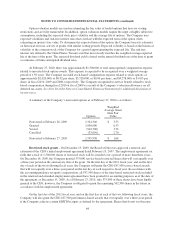
Please find page 60 of the 2010 Pier 1 annual report below. You can navigate through the pages in the report by either clicking on the pages listed below, or by using the keyword search tool below to find specific information within the annual report.-
 1
1 -
2
-
3
-
4
-
5
-
6
-
7
-
8
-
9
-
10
-
11
-
12
-
13
-
14
-
15
-
16
-
17
-
18
-
19
-
20
-
21
-
22
-
23
-
24
-
25
-
26
-
27
-
28
-
29
-
30
-
31
-
32
-
33
-
34
-
35
-
36
-
37
-
38
-
39
-
40
-
41
-
42
-
43
-
44
-
45
-
46
-
47
-
48
-
49
-
 50
50 -
 51
51 -
 52
52 -
 53
53 -
 54
54 -
 55
55 -
 56
56 -
 57
57 -
 58
58 -
 59
59 -
 60
60 -
 61
61 -
 62
62 -
 63
63 -
 64
64 -
 65
65 -
 66
66 -
 67
67 -
 68
68 -
 69
69 -
 70
70 -
71
-
72
-
73
-
74
-
75
-
76
-
77
-
78
-
79
-
80
-
81
-
82
-
83
-
84
-
85
-
86
-
87
-
88
-
89
-
90
-
91
-
92
-
93
-
94
-
95
-
96
-
97
-
98
-
99
-
100
-
101
-
102
-
103
-
104
-
105
-
106
-
107
-
108
-
109
-
110
-
111
-
112
-
113
-
114
-
115
-
116
-
117
-
118
-
119
-
120
-
121
-
122
-
123
-
124
-
125
-
126
-
127
-
128
-
129
-
130
-
131
-
132
-
133
-
134
-
135
-
136
-
137
-
138
-
139
-
140
-
141
-
142
-
143
-
144
-
145
-
146
-
147
-
148
 |
 |

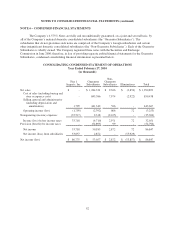
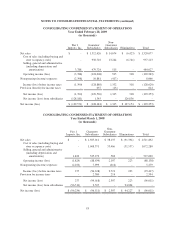
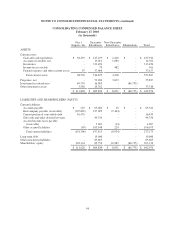
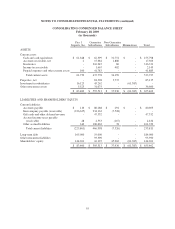
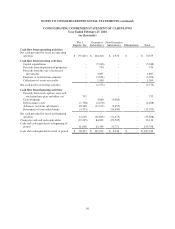
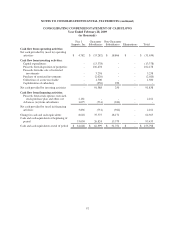
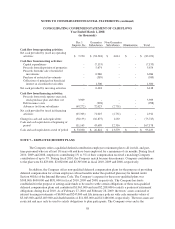
NOTES TO CONSOLIDATED FINANCIAL STATEMENTS (continued)
CONSOLIDATING CONDENSED BALANCE SHEET
February 27, 2010
(in thousands)
Pier 1
Imports, Inc.
Guarantor
Subsidiaries
Non-Guarantor
Subsidiaries Eliminations Total
ASSETS
Current assets:
Cash and cash equivalents $ 38,433 $ 147,233 $ 2,246 $ - $ 187,912
Accounts receivable, net - 13,011 1,690 - 14,701
Inventories - 313,496 - - 313,496
Income tax receivable - 79 482 - 561
Prepaid expenses and other current assets 97 37,060 - - 37,157
Total current assets 38,530 510,879 4,418 - 553,827
Properties, net - 52,204 3,633 - 55,837
Investment in subsidiaries 69,750 16,985 - (86,735) -
Other noncurrent assets 3,548 29,762 - - 33,310
$ 111,828 $ 609,830 $ 8,051 $ (86,735) $ 642,974
LIABILITIES AND SHAREHOLDERS’ EQUITY
Current liabilities:
Accounts payable $ 223 $ 65,081 $ 40 $ - $ 65,344
Intercompany payable (receivable) (207,865) 217,029 (9,164) - -
Current portion of convertible debt 16,435 - - - 16,435
Gift cards and other deferred revenue - 44,356 - - 44,356
Accrued income taxes payable
(receivable) - 5,001 (34) - 4,967
Other accrued liabilities (99) 105,948 224 - 106,073
Total current liabilities (191,306) 437,415 (8,934) - 237,175
Long-term debt - 19,000 - - 19,000
Other noncurrent liabilities - 83,665 - - 83,665
Shareholders’ equity 303,134 69,750 16,985 (86,735) 303,134
$ 111,828 $ 609,830 $ 8,051 $ (86,735) $ 642,974
54