Pier 1 2010 Annual Report Download - page 28
Download and view the complete annual report
Please find page 28 of the 2010 Pier 1 annual report below. You can navigate through the pages in the report by either clicking on the pages listed below, or by using the keyword search tool below to find specific information within the annual report.-
 1
1 -
2
-
3
-
4
-
5
-
6
-
7
-
8
-
9
-
10
-
11
-
12
-
13
-
14
-
15
-
16
-
17
-
 18
18 -
 19
19 -
 20
20 -
 21
21 -
 22
22 -
 23
23 -
 24
24 -
 25
25 -
 26
26 -
 27
27 -
 28
28 -
 29
29 -
 30
30 -
 31
31 -
 32
32 -
 33
33 -
 34
34 -
 35
35 -
 36
36 -
 37
37 -
 38
38 -
39
-
40
-
41
-
42
-
43
-
44
-
45
-
46
-
47
-
48
-
49
-
50
-
51
-
52
-
53
-
54
-
55
-
56
-
57
-
58
-
59
-
60
-
61
-
62
-
63
-
64
-
65
-
66
-
67
-
68
-
69
-
70
-
71
-
72
-
73
-
74
-
75
-
76
-
77
-
78
-
79
-
80
-
81
-
82
-
83
-
84
-
85
-
86
-
87
-
88
-
89
-
90
-
91
-
92
-
93
-
94
-
95
-
96
-
97
-
98
-
99
-
100
-
101
-
102
-
103
-
104
-
105
-
106
-
107
-
108
-
109
-
110
-
111
-
112
-
113
-
114
-
115
-
116
-
117
-
118
-
119
-
120
-
121
-
122
-
123
-
124
-
125
-
126
-
127
-
128
-
129
-
130
-
131
-
132
-
133
-
134
-
135
-
136
-
137
-
138
-
139
-
140
-
141
-
142
-
143
-
144
-
145
-
146
-
147
-
148
 |
 |

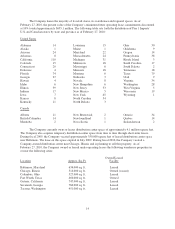
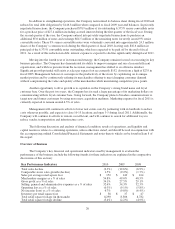
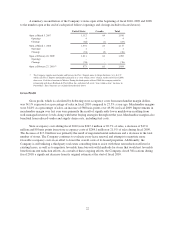
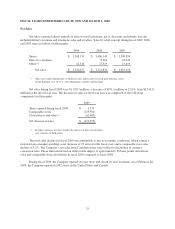
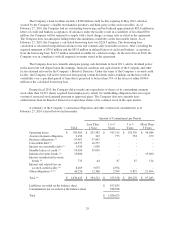
A summary reconciliation of the Company’s stores open at the beginning of fiscal 2010, 2009 and 2008
to the number open at the end of each period follows (openings and closings include relocated stores):
United States Canada Total
Open at March 3, 2007 1,112 84 1,196
Openings 4 - 4
Closings (82) (1) (83)
Open at March 1, 2008 1,034 83 1,117
Openings 1 - 1
Closings (24) (2) (26)
Open at February 28, 2009 1,011 81 1,092
Openings - - -
Closings (38) - (38)
Open at February 27, 2010 (1) 973 81 1,054
(1) The Company supplies merchandise and licenses the Pier 1 Imports name to Grupo Sanborns, S.A. de C.V.
which sells Pier 1 Imports merchandise primarily in a “store within a store” format. At the end of fiscal 2010,
there were 35 of these locations in Mexico. During the third quarter of fiscal 2010, the company ended its
relationship with Sears Roebuck de Puerto Rico, Inc. and closed all seven “store within a store” locations in
Puerto Rico. These locations are excluded from the table above.
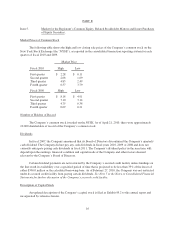
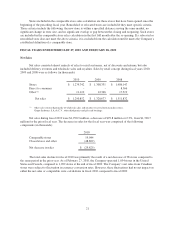
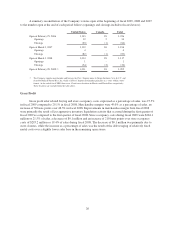
Gross Profit
Gross profit, which is calculated by deducting store occupancy costs from merchandise margin dollars,
was 34.1% expressed as a percentage of sales in fiscal 2010 compared to 27.5% a year ago. Merchandise margins
were 54.8% as a percentage of sales, an increase of 580 basis points over 49.0% in fiscal 2009. Improvements in
merchandise margin over last year were primarily the result of significantly lower markdowns resulting from
well managed inventory levels along with better buying strategies throughout the year. Merchandise margins also
benefited from reduced vendor and supply chain costs, including fuel costs.
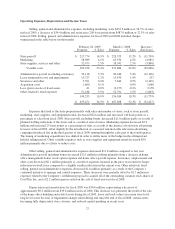
Store occupancy costs during fiscal 2010 were $267.1 million or 20.7% of sales, a decrease of $17.0
million and 80 basis points from store occupancy costs of $284.1 million or 21.5% of sales during fiscal 2009.
The decrease of $17.0 million was primarily the result of negotiated rental reductions and a decrease in the total
number of stores. The Company continues to evaluate every lease renewal and attempts to negotiate more
favorable occupancy costs in an effort to lower the overall costs of its leased properties. Additionally, the
Company is still utilizing a third-party real estate consulting firm to assist with these rent reduction efforts for
existing leases, as well as to negotiate favorable lease buyouts with landlords for stores that would not favorably
benefit from rent reduction efforts. As a result of these ongoing efforts, the Company closed 38 locations during
fiscal 2010, a significant decrease from its original estimate at the start of fiscal 2010.
22