Tesco 2008 Annual Report Download - page 103
Download and view the complete annual report
Please find page 103 of the 2008 Tesco annual report below. You can navigate through the pages in the report by either clicking on the pages listed below, or by using the keyword search tool below to find specific information within the annual report.-
 1
1 -
2
-
3
-
4
-
5
-
6
-
7
-
8
-
9
-
10
-
11
-
12
-
13
-
14
-
15
-
16
-
17
-
18
-
19
-
20
-
21
-
22
-
23
-
24
-
25
-
26
-
27
-
28
-
29
-
30
-
31
-
32
-
33
-
34
-
35
-
36
-
37
-
38
-
39
-
40
-
41
-
42
-
43
-
44
-
45
-
46
-
47
-
48
-
49
-
50
-
51
-
52
-
53
-
54
-
55
-
56
-
57
-
58
-
59
-
60
-
61
-
62
-
63
-
64
-
65
-
66
-
67
-
68
-
69
-
70
-
71
-
72
-
73
-
74
-
75
-
76
-
77
-
78
-
79
-
80
-
81
-
82
-
83
-
84
-
85
-
86
-
87
-
88
-
89
-
90
-
91
-
92
-
 93
93 -
 94
94 -
 95
95 -
 96
96 -
 97
97 -
 98
98 -
 99
99 -
 100
100 -
 101
101 -
 102
102 -
 103
103 -
 104
104 -
 105
105 -
 106
106 -
 107
107 -
 108
108 -
 109
109 -
 110
110 -
 111
111 -
 112
112
 |
 |

Tesco PLC Annual Report and
Financial Statements 2008 101
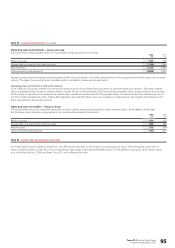
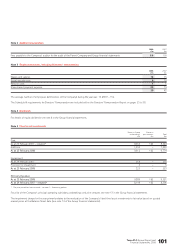
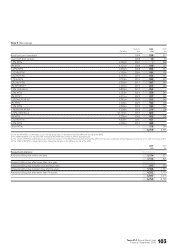
Note 2 Auditor remuneration
2008 2007
£m £m
Fees payable to the Company’s auditor for the audit of the Parent Company and Group financial statements 0.6 0.6
Note 3 Employment costs, including Directors’ remuneration
2008 2007
£m £m
Wages and salaries 12 13
Social security costs 610
Pension costs 11
Share-based payment expense 20 19
39 43
The average number of employees (all Directors of the Company) during the year was: 15 (2007 – 15).
The Schedule VI requirements for Directors’ Remuneration are included within the Directors’ Remuneration Report on pages 25 to 38.
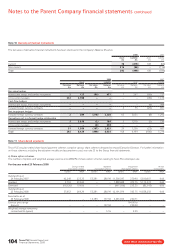
Note 4 Dividends
For details of equity dividends see note 8 in the Group financial statements.
Note 5 Fixed asset investments
Shares in Group Shares in
undertakings joint ventures Total
£m £m £m
Cost
As at 24 February 2007 – restated* 8,362 162 8,524
Additions 1,250 – 1,250
As at 23 February 2008 9,612 162 9,774
Impairment
As at 24 February 2007 218 – 218
Provision for impairment 5–5
As at 23 February 2008 223 – 223
Net carrying value
As at 23 February 2008 9,389 162 9,551
As at 24 February 2007 – restated* 8,144 162 8,306
* The prior period has been restated – see note 1 – Accounting policies.
For a list of the Company’s principal operating subsidiary undertakings and joint ventures see note 13 in the Group financial statements.
The impairment charge for the year primarily relates to the revaluation of the Company’s listed fixed asset investments to fair value based on quoted
market prices at the Balance Sheet date (see note 14 of the Group financial statements).