Tesco 2008 Annual Report Download - page 77
Download and view the complete annual report
Please find page 77 of the 2008 Tesco annual report below. You can navigate through the pages in the report by either clicking on the pages listed below, or by using the keyword search tool below to find specific information within the annual report.-
 1
1 -
2
-
3
-
4
-
5
-
6
-
7
-
8
-
9
-
10
-
11
-
12
-
13
-
14
-
15
-
16
-
17
-
18
-
19
-
20
-
21
-
22
-
23
-
24
-
25
-
26
-
27
-
28
-
29
-
30
-
31
-
32
-
33
-
34
-
35
-
36
-
37
-
38
-
39
-
40
-
41
-
42
-
43
-
44
-
45
-
46
-
47
-
48
-
49
-
50
-
51
-
52
-
53
-
54
-
55
-
56
-
57
-
58
-
59
-
60
-
61
-
62
-
63
-
64
-
65
-
66
-
 67
67 -
 68
68 -
 69
69 -
 70
70 -
 71
71 -
 72
72 -
 73
73 -
 74
74 -
 75
75 -
 76
76 -
 77
77 -
 78
78 -
 79
79 -
 80
80 -
 81
81 -
 82
82 -
 83
83 -
 84
84 -
 85
85 -
 86
86 -
 87
87 -
88
-
89
-
90
-
91
-
92
-
93
-
94
-
95
-
96
-
97
-
98
-
99
-
100
-
101
-
102
-
103
-
104
-
105
-
106
-
107
-
108
-
109
-
110
-
111
-
112
 |
 |

Tesco PLC Annual Report and
Financial Statements 2008 75
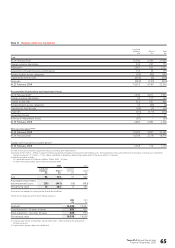
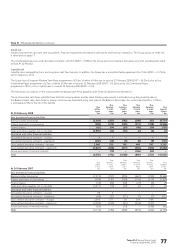
Note 20 Financial instruments continued
The fair value and notional amounts of derivatives analysed by hedge type are as follows:
2008 2007
Asset Liability Asset Liability
Fair value Notional Fair value Notional Fair value Notional Fair value Notional
£m £m £m £m £m £m £m £m
Fair value hedges
Interest rate swaps and similar instruments 2 125 (80) 657 7 267 (69) 717
Cross currency swaps 252 2,795 – – – – (45) 1,174
Cash flow hedges
Interest rate swaps and similar instruments ––––– – (9) 988
Cross currency swaps – – (1) 17 –– ––
Forward foreign currency contracts 19 811 (9) 387 2 73 (25) 691
Net investment hedges
Forward foreign currency contracts 2 289 (218) 2,328 65 3,053 (8) 1,292
Future purchases of minority interests – – (197) – – – (268) –
Derivatives not in a formal hedge relationship
Interest rate swaps and similar instruments 6 3,668 (2) 189 5 1,570 (1) 230
Cross currency swaps – – (16) 347 ––––
Forward foreign currency contracts 32 1,641 (207) 2,816 29 1,236 (23) 687
Future purchases of minority interests – – (35) – – – (38) –
Total 313 9,329 (765) 6,741 108 6,199 (486) 5,779
Carrying and fair value of financial assets and liabilities at financial year ending:
2008 2007
Carrying Fair Carrying Fair
value value value value
£m £m £m £m
Assets
Finance leases (Group as lessor – note 32) 5512 12
Cash and cash equivalents 1,788 1,788 1,042 1,042
Short-term investments 360 360 ––
Joint venture loan receivables 173 173 163 163
Derivative financial assets:
Interest rate swaps and similar instruments 8812 12
Cross currency swaps 252 252 ––
Forward foreign currency contracts 53 53 96 96
Total financial assets 2,639 2,639 1,325 1,325
Liabilities
Short-term borrowings:
Amortised cost (1,511) (1,516) (1,251) (1,251)
Bonds in fair value hedge relationships (522) (502) (267) (258)
Long-term borrowings:
Amortised cost (2,269) (2,138) (2,060) (2,028)
Bonds in fair value hedge relationships (3,488) (3,261) (1,939) (1,921)
Finance leases (Group as lessee – note 32) (266) (266) (183) (183)
Derivative and other financial liabilities:
Interest rate swaps and similar instruments (81) (81) (79) (79)
Cross currency swaps (18) (18) (45) (45)
Forward foreign currency contracts (434) (434) (56) (56)
Future purchases of minority interests (232) (232) (306) (306)
Total financial liabilities (8,821) (8,448) (6,186) (6,127)
To t a l (6,182) (5,809) (4,861) (4,802)
The fair values of financial instruments have been determined by reference to prices available from the markets on which the instruments are traded.
The fair value of all other items have been calculated by discounting expected future cash flows at prevailing interest rates. The above table excludes
other receivables/payables, which have fair values equal to their carrying values.