Tesco 2008 Annual Report Download - page 79
Download and view the complete annual report
Please find page 79 of the 2008 Tesco annual report below. You can navigate through the pages in the report by either clicking on the pages listed below, or by using the keyword search tool below to find specific information within the annual report.-
 1
1 -
2
-
3
-
4
-
5
-
6
-
7
-
8
-
9
-
10
-
11
-
12
-
13
-
14
-
15
-
16
-
17
-
18
-
19
-
20
-
21
-
22
-
23
-
24
-
25
-
26
-
27
-
28
-
29
-
30
-
31
-
32
-
33
-
34
-
35
-
36
-
37
-
38
-
39
-
40
-
41
-
42
-
43
-
44
-
45
-
46
-
47
-
48
-
49
-
50
-
51
-
52
-
53
-
54
-
55
-
56
-
57
-
58
-
59
-
60
-
61
-
62
-
63
-
64
-
65
-
66
-
67
-
68
-
 69
69 -
 70
70 -
 71
71 -
 72
72 -
 73
73 -
 74
74 -
 75
75 -
 76
76 -
 77
77 -
 78
78 -
 79
79 -
 80
80 -
 81
81 -
 82
82 -
 83
83 -
 84
84 -
 85
85 -
 86
86 -
 87
87 -
 88
88 -
 89
89 -
90
-
91
-
92
-
93
-
94
-
95
-
96
-
97
-
98
-
99
-
100
-
101
-
102
-
103
-
104
-
105
-
106
-
107
-
108
-
109
-
110
-
111
-
112
 |
 |

Tesco PLC Annual Report and
Financial Statements 2008 77
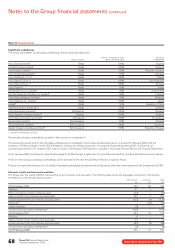
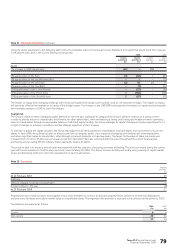
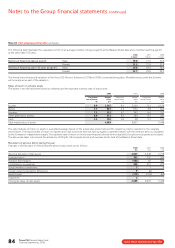
Note 21 Financial risk factors continued
Credit risk
Credit risk arises from cash and cash equivalents, financial instruments and deposits with banks and financial institutions. The Group policy on credit risk
is described on page 17.
The counterparty exposure under derivative contracts is £313m (2007 – £108m). The Group policy is to transact derivatives only with counterparties rated
at least A1 by Moody’s.
Liquidity risk
Liquidity risk is managed by short- and long-term cash flow forecasts. In addition, the Group has a committed facility agreement for £1.6bn (2007 – £1.75bn),
which matures in 2014.
The Group has a European Medium Term Note programme of £10bn, of which £4.9bn was in issue at 23 February 2008 (2007 – £4.3bn), plus a Euro
Commercial Paper programme of £2bn, of which £0.6bn was in issue at 23 February 2008 (2007 – £0.2bn), and a US Commercial Paper
programme of $1bn, none of which was in issue at 23 February 2008 (2007 – £nil).
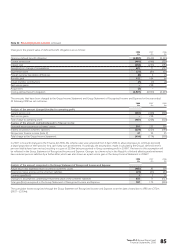
The following is an analysis of the undiscounted contractual cash flows payable under financial liabilities and derivatives.
The undiscounted cash flows will differ from both the carrying values and fair value. Floating rate interest is estimated using the prevailing rate at
the Balance Sheet date. Cash flows in foreign currencies are translated using spot rates at the Balance Sheet date. For index linked liabilities, inflation
is estimated at 3% for the life of the liability.
Due Due Due Due
Due between between between between Due
within 1 and 2 2 and 3 3 and 4 4 and 5 beyond
1 year years years years years 5 years
At 23 February 2008 £m £m £m £m £m £m
Non derivative financial liabilities
Bank and other borrowings (2,018) (287) (795) (398) (47) (4,714)
Interest payments on borrowings (298) (272) (229) (211) (198) (4,906)
Finance leases (62) (54) (50) (46) (30) (130)
Trade and other payables not in net debt (3,935) (12) (13) (2) (6) (7)
Derivative and other financial liabilities
Net settled derivative contracts – receipts 7–––––
Net settled derivative contracts – payments (230) (16) (9) (9) (9) (172)
Gross settled derivative contracts – receipts 2,968 255 705 484 297 3,207
Gross settled derivative contracts – payments (2,827) (286) (677) (452) (304) (3,280)
Future purchases of minority interests – (70) – (166) (34) –
To t a l (6,395) (742) (1,068) (800) (331) (10,002)
Due Due Due Due
Due between between between between Due
within 1 and 2 2 and 3 3 and 4 4 and 5 beyond
1 year years years years years 5 years
At 24 February 2007 £m £m £m £m £m £m
Non derivative financial liabilities
Bank and other borrowings (1,513) (531) (276) (661) (354) (2,666)
Interest payments on borrowings (268) (187) (159) (149) (114) (1,894)
Finance leases (38) (34) (28) (41) (6) (5)
Trade and other payables not in net debt (3,317) (10) (10) (1) (1) (5)
Derivative and other financial liabilities
Net settled derivative contracts – receipts 88 6 ––––
Net settled derivative contracts – payments (44) (11) (11) (7) (7) (131)
Gross settled derivative contracts – receipts 2,560 577 39 549 349 –
Gross settled derivative contracts – payments (2,584) (590) (53) (562) (351) –
Future purchases of minority interests (29) – (70) – (208) (42)
To t a l (5,145) (780) (568) (872) (692) (4,743)