APC 2002 Annual Report Download - page 21
Download and view the complete annual report
Please find page 21 of the 2002 APC annual report below. You can navigate through the pages in the report by either clicking on the pages listed below, or by using the keyword search tool below to find specific information within the annual report.-
 1
1 -
2
-
3
-
4
-
5
-
6
-
7
-
8
-
9
-
10
-
 11
11 -
 12
12 -
 13
13 -
 14
14 -
 15
15 -
 16
16 -
 17
17 -
 18
18 -
 19
19 -
 20
20 -
 21
21 -
 22
22 -
 23
23 -
 24
24 -
 25
25 -
 26
26 -
 27
27 -
 28
28 -
 29
29 -
 30
30 -
 31
31 -
32
-
33
-
34
-
35
-
36
-
37
-
38
-
39
-
40
-
41
-
42
-
43
-
44
-
45
-
46
-
47
-
48
-
49
-
50
-
51
-
52
-
53
-
54
-
55
-
56
-
57
-
58
-
59
-
60
 |
 |

Stock option plan details
Plan Date of Number Number of Price Exercise criteria % Number Number
no Board of initial options in euros of targets of options of options
Meeting grantees granted met cancelled outstanding at
(1)
Feb. 5, 2003
907.04.95 47 575,200 24.93 None N/A N/A 362,800
10 07.04.95 134 626,800 24.93 All options: ROE for 1993 -1995 54.4 279,600 50,870
11 13.06.96 233 862,800 35.37 All options: ROE for 1994-1996 62.5 339,700 353,940
12 24.01.97 53 1,360,000 35.67 None N/A N/A 1,198,200
13 10.06.97 273 970,800 44.52 All options: ROE for 1995-1997 74.9 239,400 653,630
14 28.01.98 287 1,208,000 50.77 All options: ROE for 1996-1998 85.4 164,300 1,001,800
15 22.12.98 1 60,000 50.86 50% of options: value creation for 1999-2001 55.36 13,300 46,700
16 01.04.99 337 1,259,300 50.73 50% of options: value creation for 1999-2001 55.36 245,900 937,700
17 01.04.99 542 2,123,100 50.73 All options: sales, base costs and operating
income for 2001 71.6
(2)
1,078,600 963,200
18 24.03.00 1,037 1,421,200 65.88 50% of options: value creation for 2000-2002 – 710,600 660,075
(3)
19 04.04.01 1,050 1,557,850 68.80 None N/A N/A 1,518,025
(3)
20 12.12.01 180 1,600,000 51.76 All options: 2004 sales and operating income – – 1,600,000
21 05.02.03 433 2,000,000 45.65 50% of options: operating margin
and operating income to capital employed – – 2,000,000
22 05.02.03 111 111,000 45.65 None (reserved for winners of
the NEW2004 Trophies) N/A N/A 111,000
15,736,050 11,457,940
(1) Because targets were not met.
(2) In light of the plan’s rules, 50.81% of the options were cancelled as a result of the percentage of achievement.
(3) The difference between the number of options granted and the number of options outstanding stems from the cancellation of options granted to employees who
have left the Group.
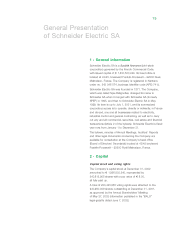
General Presentation of Schneider Electric SA
20