APC 2002 Annual Report Download - page 4
Download and view the complete annual report
Please find page 4 of the 2002 APC annual report below. You can navigate through the pages in the report by either clicking on the pages listed below, or by using the keyword search tool below to find specific information within the annual report.-
 1
1 -
 2
2 -
 3
3 -
 4
4 -
 5
5 -
 6
6 -
 7
7 -
 8
8 -
 9
9 -
 10
10 -
 11
11 -
 12
12 -
 13
13 -
 14
14 -
 15
15 -
16
-
17
-
18
-
19
-
20
-
21
-
22
-
23
-
24
-
25
-
26
-
27
-
28
-
29
-
30
-
31
-
32
-
33
-
34
-
35
-
36
-
37
-
38
-
39
-
40
-
41
-
42
-
43
-
44
-
45
-
46
-
47
-
48
-
49
-
50
-
51
-
52
-
53
-
54
-
55
-
56
-
57
-
58
-
59
-
60
 |
 |
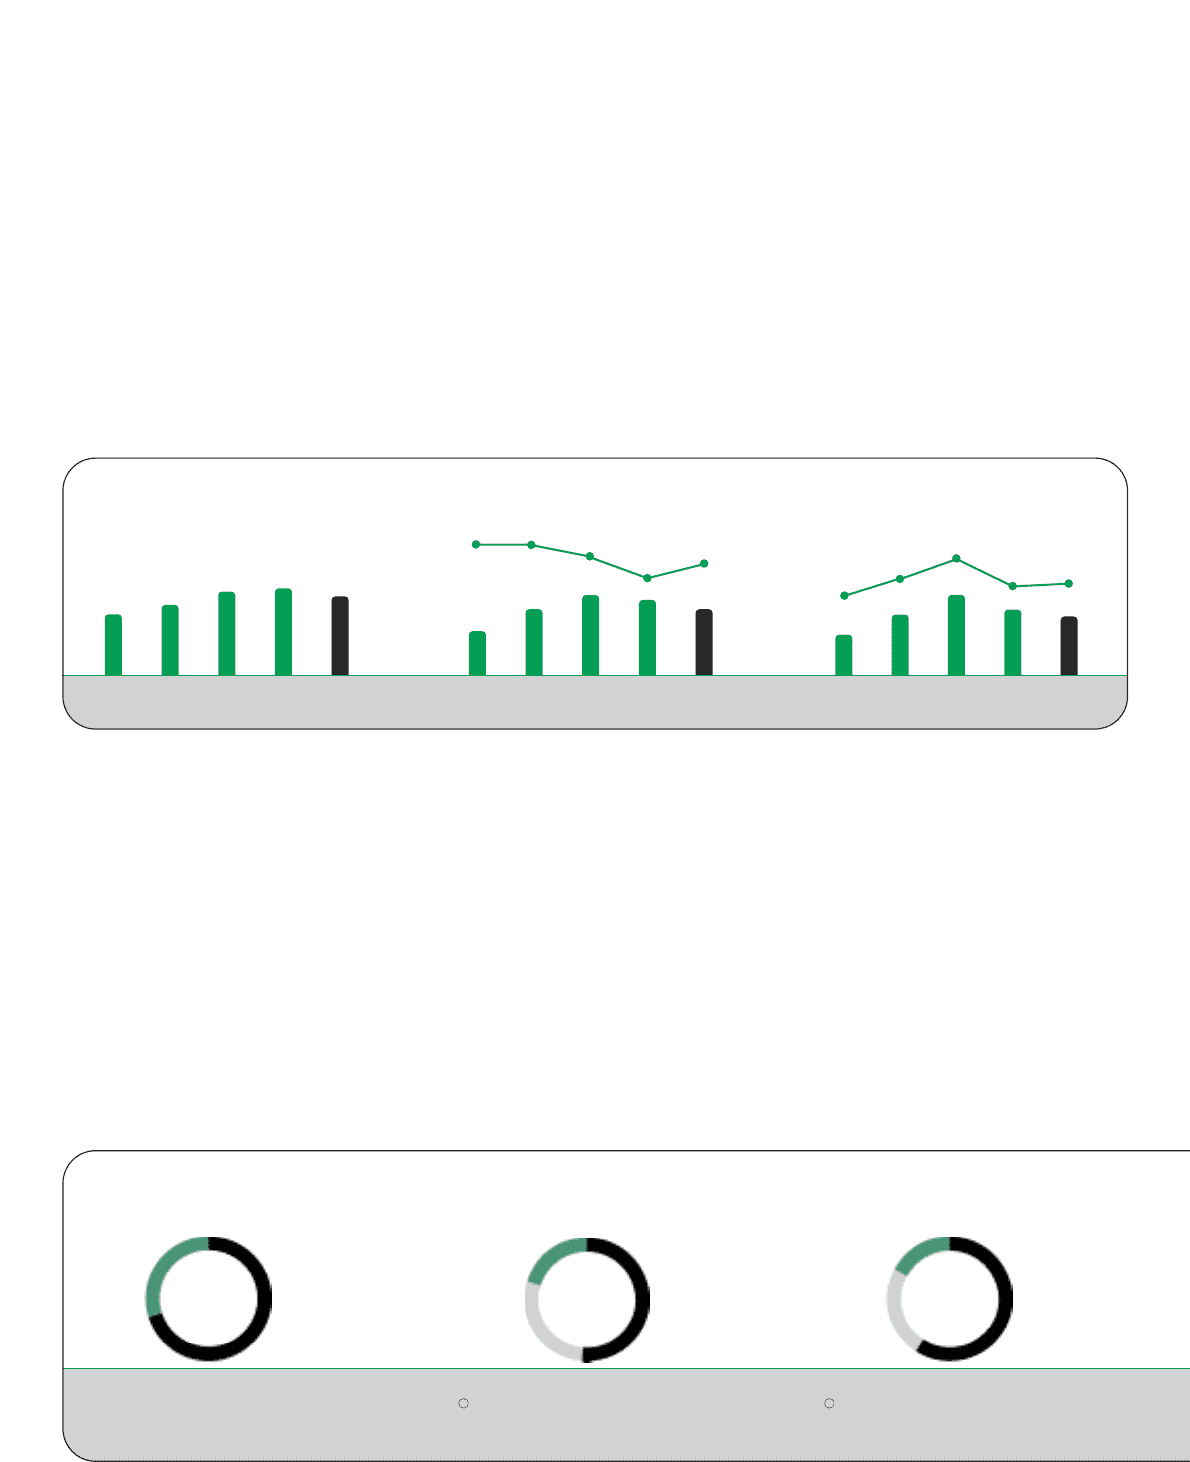
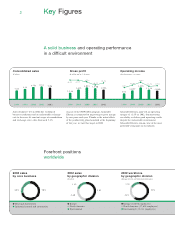
Key Figures
A solid business and operating performance
in a difficult environment
Forefront positions
worldwide
2
30% 70%
2002 sales
by geographic division
( billion)
2002 workforce
by geographic division
(Average full-time and temporary employees)
1.82
4.64
2.60
17%
59%
24%
● Electrical distribution
●Industrial control and automation
● Europe
●North America
●International
● Europe (44,078 employees)
●North America (17,625 employees)
● International (13,111 employees)
2002 sales
by core business
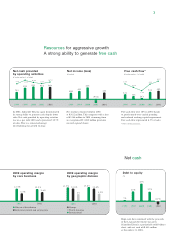
Sales declined 7.8% in 2002 due to difficult
business conditions and an unfavorable exchange
rate to the euro. At constant scope of consolidation
and exchange rates, sales decreased 5.2%.
Schneider Electric achieved an operating
margin of 11.5% in 2002, demonstrating
our ability to deliver good operating results
despite the unfavorable environment.
Schneider Electric remains one of the most
profitable companies in its industry.
As part of the NEW2004 program, Schneider
Electric is committed to improving its gross margin
by one point each year. T hanks to the initial effects
of the productivity plans launched at the beginning
of the year, we met this target in 2002.
Gross profit
( million and as % of sales)
3,284
3,612 4,083 3,950 3,755
Consolidated sales
( billion)
Operating income
( million and as % of sales)
9.06
7.63 8.38 9.70 9.83
853
1,057
1,298 1,116 1,040
11.5%
11.4%
1998 1999 2000 2001 1998 1999 2000 20012002 20021998 1999 2000 2001 2002
11.2%
12.6%
13.4%
43.1% 43.1%
42.1%
40.2%
41.4%