APC 2002 Annual Report Download - page 50
Download and view the complete annual report
Please find page 50 of the 2002 APC annual report below. You can navigate through the pages in the report by either clicking on the pages listed below, or by using the keyword search tool below to find specific information within the annual report.-
 1
1 -
2
-
3
-
4
-
5
-
6
-
7
-
8
-
9
-
10
-
11
-
12
-
13
-
14
-
15
-
16
-
17
-
18
-
19
-
20
-
21
-
22
-
23
-
24
-
25
-
26
-
27
-
28
-
29
-
30
-
31
-
32
-
33
-
34
-
35
-
36
-
37
-
38
-
39
-
 40
40 -
 41
41 -
 42
42 -
 43
43 -
 44
44 -
 45
45 -
 46
46 -
 47
47 -
 48
48 -
 49
49 -
 50
50 -
 51
51 -
 52
52 -
 53
53 -
 54
54 -
 55
55 -
 56
56 -
 57
57 -
 58
58 -
 59
59 -
 60
60
 |
 |

49
Workforce and training data
A set of Human Resources performance indicators has been
used to consolidate data worldwide since 1999.
The following information was extracted from this data.
2002 headcount 74,814
Turnover/ins 8,810
Turnover/outs 10,655
Training
Number of training days
per person 2.8 days
Number of people who
underwent training 71628
* calculations based on spot headcount
(contract, permanent and temporary) employees
as at December 31, 2002.
Men/Women Breakdown*
36%
● Men
● Women
64%
Professional Category*
● Engineers and managers
●Non-exempt - technicians
● Workers
27%
27%
46%
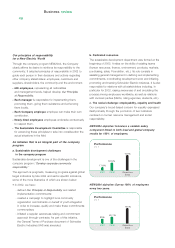
Age*
● Age –25
● Age 25/34
● Age 35/44
30.80%
25.40%
7.10%
9.50%
27.20%
●Age 45/54
●Age +55
Seniority*
● - 5 years
● 5/15 years
● 16/24 years
14.90% 26.60%
29.60%
2.30%
26.60%
●25/34 years
●+35 years