APC 2002 Annual Report Download - page 5
Download and view the complete annual report
Please find page 5 of the 2002 APC annual report below. You can navigate through the pages in the report by either clicking on the pages listed below, or by using the keyword search tool below to find specific information within the annual report.-
 1
1 -
 2
2 -
 3
3 -
 4
4 -
 5
5 -
 6
6 -
 7
7 -
 8
8 -
 9
9 -
 10
10 -
 11
11 -
 12
12 -
 13
13 -
 14
14 -
 15
15 -
 16
16 -
17
-
18
-
19
-
20
-
21
-
22
-
23
-
24
-
25
-
26
-
27
-
28
-
29
-
30
-
31
-
32
-
33
-
34
-
35
-
36
-
37
-
38
-
39
-
40
-
41
-
42
-
43
-
44
-
45
-
46
-
47
-
48
-
49
-
50
-
51
-
52
-
53
-
54
-
55
-
56
-
57
-
58
-
59
-
60
 |
 |

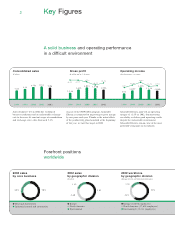
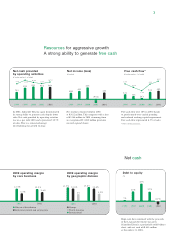
Resources for aggressive growth
A strong ability to generate free cash
3
2002 operating margin
by core business
●Electrical distribution
● Industrial control and automation
2002 operating margin
by geographic division
12.5%
8.7%
12.2%
9.6%
2001 2002
13.5% 12.6% 13.6%
8.2%
2002
8%
12.6%
2001
● Europe
●North America
● International
High cash flow combined with the proceeds
of the Legrand divestment has given
Schneider Electric a particularly solid balance
sheet, with net cash of 844 million
at December 31, 2002.
Net cash
Debt to equity
(%)
28% 27%
7%
47%
1998 1999 2000 2001 2002
(11%)
Net income remained solid in 2002
at 422 million. This compares with a loss
of 986 million in 2001 stemming from
an exceptional 1,400 million provision
on our Legrand shares.
In 2002, Schneider Electric again demonstrated
its strong ability to generate cash despite lower
sales. Net cash provided by operating activities
was on a par with 2001 and represented 10.7%
of sales. This is a crucial advantage
for deploying our growth strategy.
Free cash flow rose 10% in 2002 thanks
to good control over capital spending
and reduced working capital requirement.
Free cash flow represented 6.5% of sales.
* Before dividend payment.
Net cash provided
by operating activities
( million and as % of sales)
Free cash flow*
( million and as % of sales)
968
741
929 991 966
424 333 243
538 592
Net income (loss)
( million)
409 491
625
422
1998 1999 2000 2001 1998 1999 2000 20012002 20021998 1999 2000 2001 2002
(986)
10.7%
9.8%
9.7% 11.1% 10.2% 6.5%
5.5%
5.6%
4.0%
2.5%