American Airlines 2009 Annual Report Download - page 110
Download and view the complete annual report
Please find page 110 of the 2009 American Airlines annual report below. You can navigate through the pages in the report by either clicking on the pages listed below, or by using the keyword search tool below to find specific information within the annual report.-
 1
1 -
2
-
3
-
4
-
5
-
6
-
7
-
8
-
9
-
10
-
11
-
12
-
13
-
14
-
15
-
16
-
17
-
18
-
19
-
20
-
21
-
22
-
23
-
24
-
25
-
26
-
27
-
28
-
29
-
30
-
31
-
32
-
33
-
34
-
35
-
36
-
37
-
38
-
39
-
40
-
41
-
42
-
43
-
44
-
45
-
46
-
47
-
48
-
49
-
50
-
51
-
52
-
53
-
54
-
55
-
56
-
57
-
58
-
59
-
60
-
61
-
62
-
63
-
64
-
65
-
66
-
67
-
68
-
69
-
70
-
71
-
72
-
73
-
74
-
75
-
76
-
77
-
78
-
79
-
80
-
81
-
82
-
83
-
84
-
85
-
86
-
87
-
88
-
89
-
90
-
91
-
92
-
93
-
94
-
95
-
96
-
97
-
98
-
99
-
 100
100 -
 101
101 -
 102
102 -
 103
103 -
 104
104 -
 105
105 -
 106
106 -
 107
107 -
 108
108 -
 109
109 -
 110
110 -
 111
111
 |
 |
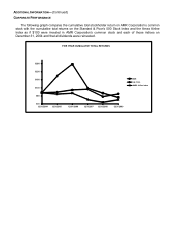
ADDITIONAL INFORMATION—(Continued)
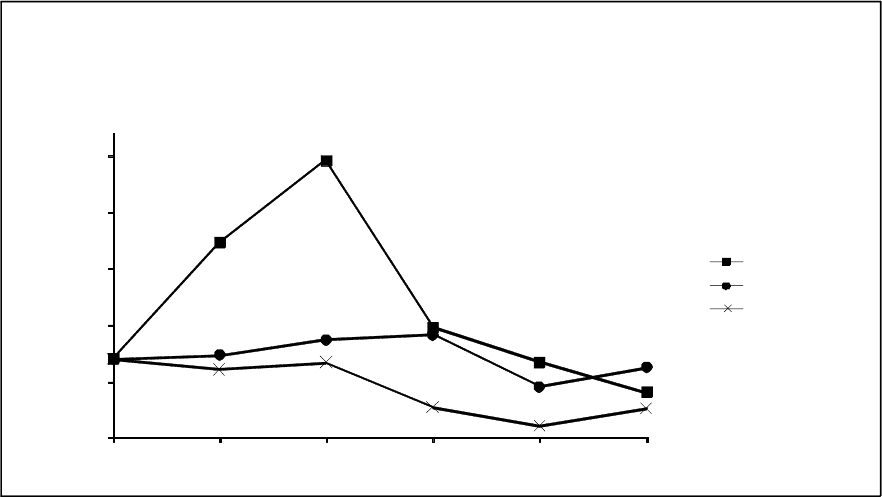
CORPORATE PERFORMANCE
The following graph compares the cumulative total stockholder return on AMR Corporation’s common
stock with the cumulative total returns on the Standard & Poor’s 500 Stock Index and the Amex Airline
Index as if $100 were invested in AMR Corporation’s common stock and each of those indices on
December 31, 2004 and that all dividends were reinvested.
$30
$80
$130
$180
$230
$280
12/31/2004
12/31/2005
12/31/2006
12/31/2007
12/31/2008
12/31/2009
FIVE YEAR CUMULATIVE TOTAL RETURNS
AMR
S & P 500
AMEX Airline Index