American Airlines 2009 Annual Report Download - page 74
Download and view the complete annual report
Please find page 74 of the 2009 American Airlines annual report below. You can navigate through the pages in the report by either clicking on the pages listed below, or by using the keyword search tool below to find specific information within the annual report.-
 1
1 -
2
-
3
-
4
-
5
-
6
-
7
-
8
-
9
-
10
-
11
-
12
-
13
-
14
-
15
-
16
-
17
-
18
-
19
-
20
-
21
-
22
-
23
-
24
-
25
-
26
-
27
-
28
-
29
-
30
-
31
-
32
-
33
-
34
-
35
-
36
-
37
-
38
-
39
-
40
-
41
-
42
-
43
-
44
-
45
-
46
-
47
-
48
-
49
-
50
-
51
-
52
-
53
-
54
-
55
-
56
-
57
-
58
-
59
-
60
-
61
-
62
-
63
-
 64
64 -
 65
65 -
 66
66 -
 67
67 -
 68
68 -
 69
69 -
 70
70 -
 71
71 -
 72
72 -
 73
73 -
 74
74 -
 75
75 -
 76
76 -
 77
77 -
 78
78 -
 79
79 -
 80
80 -
 81
81 -
 82
82 -
 83
83 -
 84
84 -
85
-
86
-
87
-
88
-
89
-
90
-
91
-
92
-
93
-
94
-
95
-
96
-
97
-
98
-
99
-
100
-
101
-
102
-
103
-
104
-
105
-
106
-
107
-
108
-
109
-
110
-
111
 |
 |

71
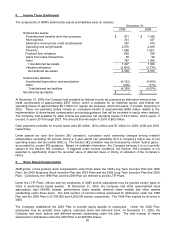
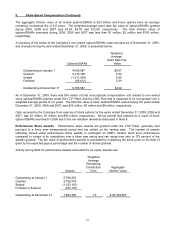
9. Share Based Compensation (Continued)
The aggregate intrinsic value of all vested options/SSARs is $33 million and those options have an average
remaining contractual life of 3.0 years. The weighted-average grant date fair value of options/SSARs granted
during 2009, 2008 and 2007 was $2.54, $3.78 and $12.63, respectively. The total intrinsic value of
options/SSARs exercised during 2009, 2008 and 2007 was less than $1 million, $2 million and $193 million,
respectively.
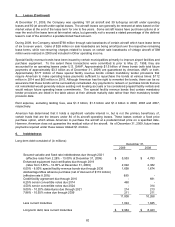
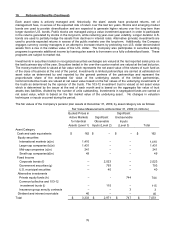
A summary of the status of the Company’s non-vested options/SSARs under all plans as of December 31, 2009,
and changes during the year ended December 31, 2009, is presented below:
Weighted
Options/SSARs
Average
Grant Date Fair
Value
Outstanding at January 1
4,409,987
$5.87
Granted
3,733,760
2.54
Vested
(1,311,554)
5.98
Forfeited
(66,612)
5.29
Outstanding at December 31
6,765,581
$4.02
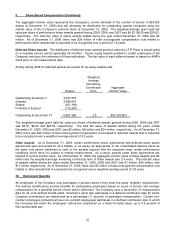
As of December 31, 2009, there was $14 million of total unrecognized compensation cost related to non-vested
stock options/SSARs granted under the LTIP Plans and the 2003 Plan that is expected to be recognized over a
weighted-average period of 3.3 years. The total fair value of stock options/SSARs vested during the years ended
December 31, 2009, 2008 and 2007, was $10 million, $9 million and $9 million, respectively.
Cash received by the Company from exercise of stock options for the years ended December 31, 2009, 2008 and
2007, was $1 million, $1 million and $90 million, respectively. No tax benefit was realized as a result of stock
options/SSARs exercised in 2009 due to the tax valuation allowance discussed in Note 8.
Performance Share Awards Performance share awards are granted under the LTIP Plans, generally vest
pursuant to a three year measurement period and are settled on the vesting date. The number of awards
ultimately issued under performance share awards is contingent on AMR’s relative stock price performance
compared to certain of its competitors over a three year period and can range from zero to 175 percent of the
awards granted. The fair value of performance awards is calculated by multiplying the stock price on the date of
grant by the expected payout percentage and the number of shares granted.
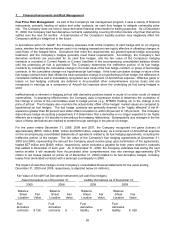
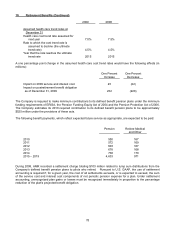
Activity during 2009 for performance awards accounted for as equity awards was:
Weighted
Average
Awards
Remaining
Contractual
Term
Aggregate
Intrinsic Value
Outstanding at January 1
5,766,253
Granted
3,792,575
Settled
(1,152,197)
Forfeited or Expired
(543,176)
Outstanding at December 31
7,863,455
1.5
$ 60,784,507