American Airlines 2009 Annual Report Download - page 69
Download and view the complete annual report
Please find page 69 of the 2009 American Airlines annual report below. You can navigate through the pages in the report by either clicking on the pages listed below, or by using the keyword search tool below to find specific information within the annual report.-
 1
1 -
2
-
3
-
4
-
5
-
6
-
7
-
8
-
9
-
10
-
11
-
12
-
13
-
14
-
15
-
16
-
17
-
18
-
19
-
20
-
21
-
22
-
23
-
24
-
25
-
26
-
27
-
28
-
29
-
30
-
31
-
32
-
33
-
34
-
35
-
36
-
37
-
38
-
39
-
40
-
41
-
42
-
43
-
44
-
45
-
46
-
47
-
48
-
49
-
50
-
51
-
52
-
53
-
54
-
55
-
56
-
57
-
58
-
 59
59 -
 60
60 -
 61
61 -
 62
62 -
 63
63 -
 64
64 -
 65
65 -
 66
66 -
 67
67 -
 68
68 -
 69
69 -
 70
70 -
 71
71 -
 72
72 -
 73
73 -
 74
74 -
 75
75 -
 76
76 -
 77
77 -
 78
78 -
 79
79 -
80
-
81
-
82
-
83
-
84
-
85
-
86
-
87
-
88
-
89
-
90
-
91
-
92
-
93
-
94
-
95
-
96
-
97
-
98
-
99
-
100
-
101
-
102
-
103
-
104
-
105
-
106
-
107
-
108
-
109
-
110
-
111
 |
 |

66
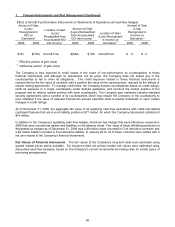
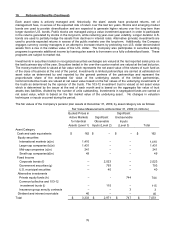
7. Financial Instruments and Risk Management (Continued)
Effect of Aircraft Fuel Derivative Instruments on Statements of Operations (all cash flow hedges)
Amount of Gain
(Loss)
Recognized in
OCI on
Derivative1
Location of Gain
(Loss)
Reclassified from
Accumulated OCI
into Income 1
Amount of Gain
(Loss) Reclassified
from Accumulated
OCI into Income 1
Location of Gain
(Loss) Recognized
in Income on
Derivative 2
Amount of Gain
(Loss)
Recognized in
Income on
Derivative 2
2009
2008
2009
2008
2009
2008
$151
$(738)
Aircraft Fuel
$(662)
$ 378
Aircraft Fuel
$ 11
$ 2
1 Effective portion of gain (loss)
2 Ineffective portion of gain (loss)
The Company is also exposed to credit losses in the event of non-performance by counterparties to these
financial instruments, and although no assurances can be given, the Company does not expect any of the
counterparties to fail to meet its obligations. The credit exposure related to these financial instruments is
represented by the fair value of contracts with a positive fair value at the reporting date, reduced by the effects of
master netting agreements. To manage credit risks, the Company selects counterparties based on credit ratings,
limits its exposure to a single counterparty under defined guidelines, and monitors the market position of the
program and its relative market position with each counterparty. The Company also maintains industry-standard
security agreements with a number of its counterparties which may require the Company or the counterparty to
post collateral if the value of selected instruments exceed specified mark-to-market thresholds or upon certain
changes in credit ratings.
As of December 31, 2009, the aggregate fair value of all qualifying cash flow derivatives with credit-risk-related
contingent features that are in a net liability position is $71 million, for which the Company had posted collateral of
$14 million.
In addition to the Company’s qualifying cash flow hedges, American has hedges that were effectively unwound in
2008 that were recorded as assets and liabilities on the balance sheet. Fair value of these offsetting positions not
designated as hedges as of December 31, 2009 was a $9 million asset recorded in Fuel derivative contracts and
a $9 million liability recorded in Fuel derivative liability. In January 2010, all of these contracts were settled with a
net zero impact to the Company’s financial statements.
Fair Values of Financial Instruments The fair values of the Company's long-term debt were estimated using
quoted market prices where available. For long-term debt not actively traded, fair values were estimated using
discounted cash flow analyses, based on the Company's current incremental borrowing rates for similar types of
borrowing arrangements.