American Airlines 2009 Annual Report Download - page 62
Download and view the complete annual report
Please find page 62 of the 2009 American Airlines annual report below. You can navigate through the pages in the report by either clicking on the pages listed below, or by using the keyword search tool below to find specific information within the annual report.-
 1
1 -
2
-
3
-
4
-
5
-
6
-
7
-
8
-
9
-
10
-
11
-
12
-
13
-
14
-
15
-
16
-
17
-
18
-
19
-
20
-
21
-
22
-
23
-
24
-
25
-
26
-
27
-
28
-
29
-
30
-
31
-
32
-
33
-
34
-
35
-
36
-
37
-
38
-
39
-
40
-
41
-
42
-
43
-
44
-
45
-
46
-
47
-
48
-
49
-
50
-
51
-
 52
52 -
 53
53 -
 54
54 -
 55
55 -
 56
56 -
 57
57 -
 58
58 -
 59
59 -
 60
60 -
 61
61 -
 62
62 -
 63
63 -
 64
64 -
 65
65 -
 66
66 -
 67
67 -
 68
68 -
 69
69 -
 70
70 -
 71
71 -
 72
72 -
73
-
74
-
75
-
76
-
77
-
78
-
79
-
80
-
81
-
82
-
83
-
84
-
85
-
86
-
87
-
88
-
89
-
90
-
91
-
92
-
93
-
94
-
95
-
96
-
97
-
98
-
99
-
100
-
101
-
102
-
103
-
104
-
105
-
106
-
107
-
108
-
109
-
110
-
111
 |
 |

59
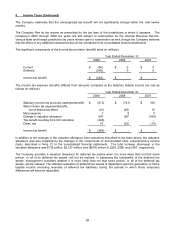
2. Special Charges and Restructuring Activities (Continued)
Other
On September 22, 2001, the Air Transportation Safety and System Stabilization Act (the Stabilization Act) was
signed into law. The Stabilization Act provides that, notwithstanding any other provision of law, liability for all
claims, whether compensatory or punitive, arising from the Terrorist Attacks, against any air carrier shall not
exceed the liability coverage maintained by the air carrier. Based upon estimates provided by the Company’s
insurance providers, the Company initially recorded a liability of approximately $2.3 billion for claims arising from
the Terrorist Attacks, after considering the liability protections provided for by the Stabilization Act. The receivable
and the liability, recorded in the accompanying consolidated balance sheet as Other assets and Other liabilities
and deferred credits, respectively, was $1.7 billion at both December 31, 2009 and 2008.
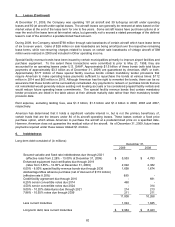
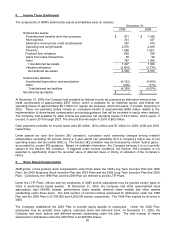
3. Investments and Fair Value Measurements
Short-term investments consisted of (in millions):
December 31,
2009
2008
Overnight investments and time deposits
$ 1,415
$ 1,574
Corporate and bank notes
2,527
1,016
U. S. government agency notes
300
322
Other
4
4
$ 4,246
$ 2,916
Short-term investments at December 31, 2009, by contractual maturity included (in millions):
Due in one year or less
$ 3,946
Due between one year and three years
300
Due after three years
-
$ 4,246
All short-term investments are classified as available-for-sale and stated at fair value. Unrealized gains and
losses are reflected as a component of Accumulated other comprehensive income (loss).
The Company utilizes the market approach to measure fair value for its financial assets and liabilities. The
market approach uses prices and other relevant information generated by market transactions involving identical
or comparable assets or liabilities.
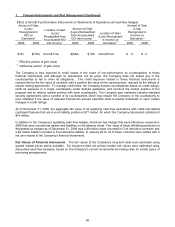
Assets and liabilities measured at fair value on a recurring basis are summarized below:
(in millions)
Description Total
Level 1 Level 2 Level 3
Short term investments 14,246$ 499$ 3,747$ -$
Restricted cash and short-term investments 1460 460 - -
Fuel derivative contracts 1 135 135
Fuel derivative liability 1(80) - (80) -
Total 4,761$ 959$ 3,802$ -$
Fair Value Measurements as of December 31, 2009
1 Unrealized gains or losses on short term investments, restricted cash and short-term investments and
derivatives qualifying for hedge accounting are recorded in Accumulated other comprehensive income (loss)
at each measurement date.