Apple 2003 Annual Report Download - page 21
Download and view the complete annual report
Please find page 21 of the 2003 Apple annual report below. You can navigate through the pages in the report by either clicking on the pages listed below, or by using the keyword search tool below to find specific information within the annual report.-
 1
1 -
2
-
3
-
4
-
5
-
6
-
7
-
8
-
9
-
10
-
 11
11 -
 12
12 -
 13
13 -
 14
14 -
 15
15 -
 16
16 -
 17
17 -
 18
18 -
 19
19 -
 20
20 -
 21
21 -
 22
22 -
 23
23 -
 24
24 -
 25
25 -
 26
26 -
 27
27 -
 28
28 -
 29
29 -
 30
30 -
 31
31 -
32
-
33
-
34
-
35
-
36
-
37
-
38
-
39
-
40
-
41
-
42
-
43
-
44
-
45
-
46
-
47
-
48
-
49
-
50
-
51
-
52
-
53
-
54
-
55
-
56
-
57
-
58
-
59
-
60
-
61
-
62
-
63
-
64
-
65
-
66
-
67
-
68
-
69
-
70
-
71
-
72
-
73
-
74
-
75
-
76
-
77
-
78
-
79
-
80
-
81
-
82
-
83
-
84
-
85
-
86
-
87
-
88
-
89
-
90
-
91
-
92
-
93
-
94
-
95
-
96
-
97
-
98
-
99
-
100
-
101
-
102
-
103
-
104
-
105
-
106
-
107
-
108
-
109
-
110
-
111
-
112
-
113
-
114
-
115
-
116
-
117
-
118
-
119
-
120
-
121
-
122
-
123
-
124
-
125
-
126
-
127
-
128
-
129
-
130
-
131
-
132
-
133
-
134
-
135
-
136
-
137
-
138
-
139
-
140
-
141
-
142
-
143
-
144
-
145
-
146
-
147
-
148
-
149
-
150
-
151
-
152
-
153
-
154
-
155
-
156
-
157
-
158
-
159
-
160
-
161
-
162
-
163
-
164
 |
 |
Notes:
(a)
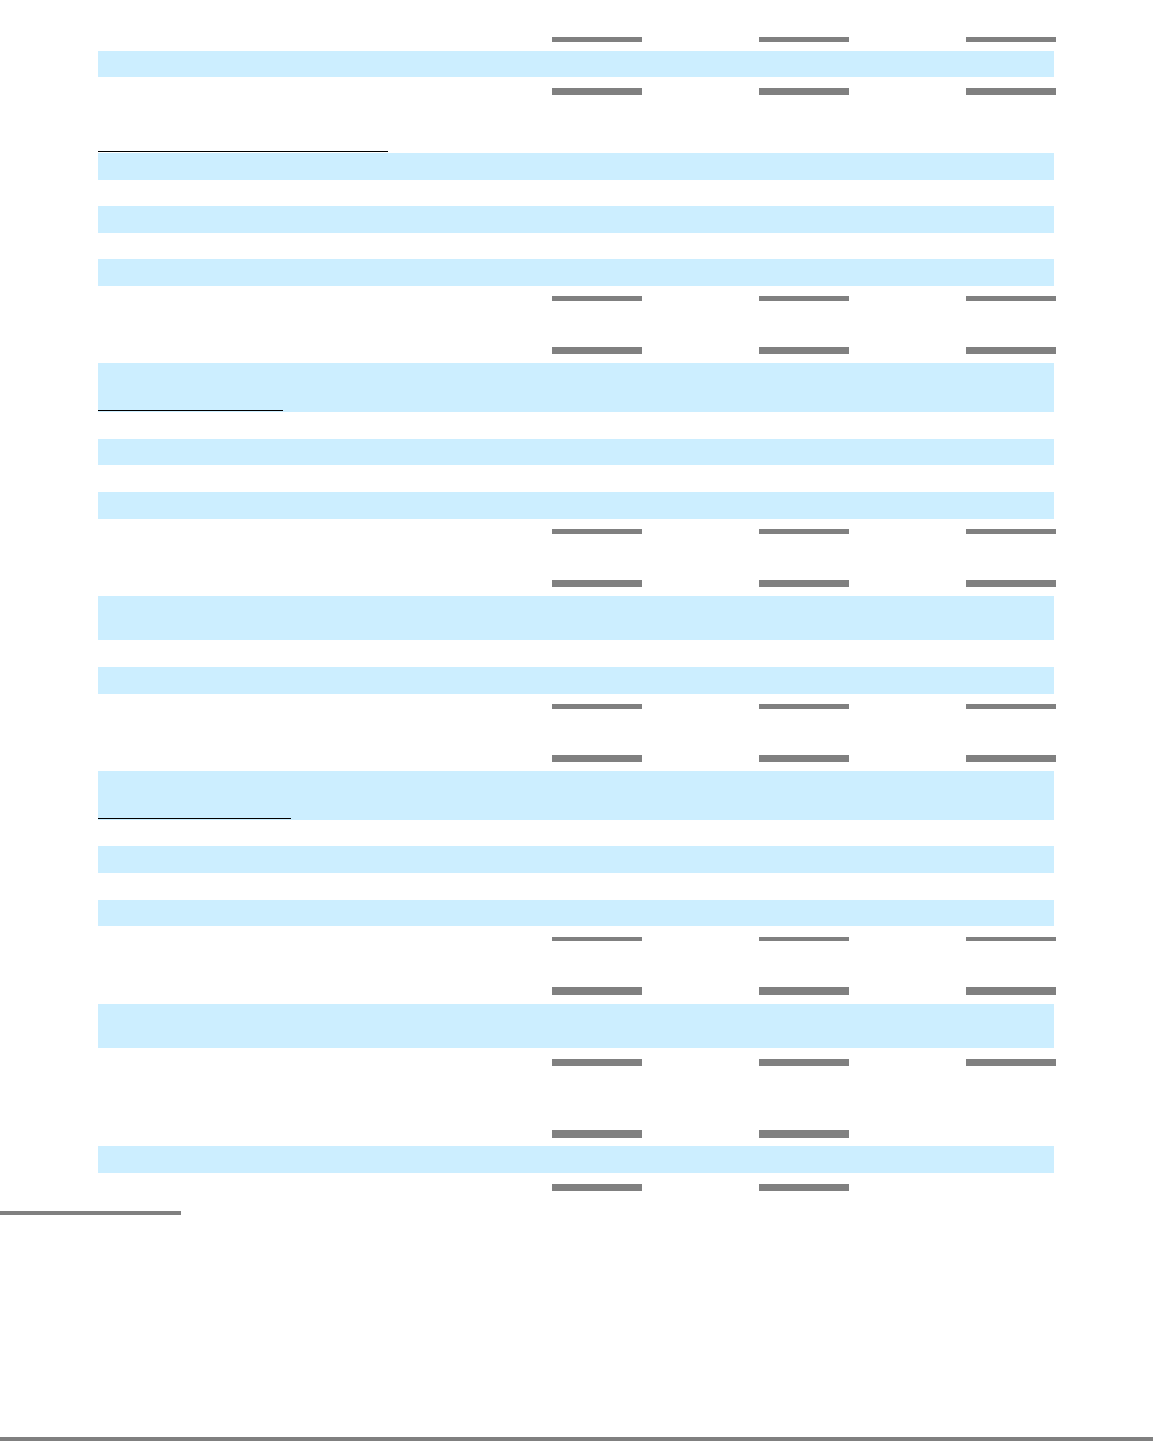
Other segments net sales (a)
398
8
%
367
6
%
345
Total net sales $
6,207
8
%
$
5,742
7
%
$
5,363
Unit Sales by Operating Segment:
Americas Macintosh unit sales
1,620
(6
)%
1,728
(2
)%
1,768
Europe Macintosh unit sales
684
(5
)%
722
(4
)%
754
Japan Macintosh unit sales
339
(12
)%
386
(2
)%
394
Retail Macintosh unit sales
187
103
%
92
—
7
Other segments Macintosh unit sales (a)
182
5
%
173
5
%
164
Total Macintosh unit sales
3,012
(3
)%
3,101
0
%
3,087
Net Sales by Product:
Power Macintosh net sales (b) $
1,237
(10
)% $
1,380
(17
)% $
1,664
PowerBook net sales
1,299
56
%
831
2
%
813
iMac net sales
1,238
(15
)%
1,448
30
%
1,117
iBook net sales
717
(18
)%
875
8
%
809
Total Macintosh net sales
4,491
(1
)%
4,534
3
%
4,403
Peripherals and other hardware (c)
1,058
57
%
674
74
%
387
Software (d)
362
18
%
307
33
%
230
Service and other sales
296
30
%
227
(34
)%
343
Total net sales $
6,207
8
%
$
5,742
7
%
$
5,363
Unit Sales by Product:
Power Macintosh unit sales (b)
667
(13
)%
766
(18
)%
937
PowerBook unit sales
604
69
%
357
3
%
346
iMac unit sales
1,094
(16
)%
1,301
8
%
1,208
iBook unit sales
647
(4
)%
677
14
%
596
Total Macintosh unit sales
3,012
(3
)%
3,101
0
%
3,087
Net sales per Macintosh unit sold (e)
$
1,491
2
%
$
1,462
3
%
$
1,426
iPod unit sales
939
146
%
381
—
—
iPod net sales $
345
141
%
$
143
—
—
Other segments consists of Asia Pacific and FileMaker. Certain net sales in 2002 and 2001 related to recent acquisitions and Internet
services have been reclassified from Other segments net sales to Americas segment net sales to conform to the 2003 presentation.
24
(b)
Power Macintosh figures include server sales.