Apple 2015 Annual Report Download - page 55
Download and view the complete annual report
Please find page 55 of the 2015 Apple annual report below. You can navigate through the pages in the report by either clicking on the pages listed below, or by using the keyword search tool below to find specific information within the annual report.-
 1
1 -
2
-
3
-
4
-
5
-
6
-
7
-
8
-
9
-
10
-
11
-
12
-
13
-
14
-
15
-
16
-
17
-
18
-
19
-
20
-
21
-
22
-
23
-
24
-
25
-
26
-
27
-
28
-
29
-
30
-
31
-
32
-
33
-
34
-
35
-
36
-
37
-
38
-
39
-
40
-
41
-
42
-
43
-
44
-
 45
45 -
 46
46 -
 47
47 -
 48
48 -
 49
49 -
 50
50 -
 51
51 -
 52
52 -
 53
53 -
 54
54 -
 55
55 -
 56
56 -
 57
57 -
 58
58 -
 59
59 -
 60
60 -
 61
61 -
 62
62 -
 63
63 -
 64
64 -
 65
65 -
66
-
67
-
68
-
69
-
70
-
71
-
72
-
73
-
74
-
75
-
76
-
77
-
78
-
79
-
80
-
81
-
82
-
83
-
84
 |
 |

The notional amounts for outstanding derivative instruments provide one measure of the transaction volume outstanding and do not represent
the amount of the Company’s exposure to credit or market loss. The credit risk amounts represent the Company’s gross exposure to potential
accounting loss on derivative instruments that are outstanding or unsettled if all counterparties failed to perform according to the terms of the
contract, based on then-current currency or interest rates at each respective date. The Company’s exposure to credit loss and market risk will
vary over time as currency and interest rates change. Although the table above reflects the notional and credit risk amounts of the Company’s
derivative instruments, it does not reflect the gains or losses associated with the exposures and transactions that the instruments are intended
to hedge. The amounts ultimately realized upon settlement of these financial instruments, together with the gains and losses on the underlying
exposures, will depend on actual market conditions during the remaining life of the instruments.
The Company generally enters into master netting arrangements, which are designed to reduce credit risk by permitting net settlement of
transactions with the same counterparty. To further limit credit risk, the Company generally enters into collateral security arrangements
that provide for collateral to be received or posted when the net fair value of certain financial instruments fluctuates from contractually
established thresholds. The Company presents its derivative assets and derivative liabilities at their gross fair values in its Consolidated
Balance Sheets. The net cash collateral received by the Company related to derivative instruments under its collateral security
arrangements was $1.0 billion as of September 26, 2015 and $2.1 billion as of September 27, 2014.
Under master netting arrangements with the respective counterparties to the Company’s derivative contracts, the Company is allowed to
net settle transactions with a single net amount payable by one party to the other. As of September 26, 2015 and September 27, 2014,
the potential effects of these rights of set-off associated with the Company’s derivative contracts, including the effects of collateral, would
be a reduction to both derivative assets and derivative liabilities of $2.2 billion and $1.6 billion, respectively, resulting in net derivative
liabilities of $78 million and $549 million, respectively.
Accounts Receivable
Trade Receivables
The Company has considerable trade receivables outstanding with its third-party cellular network carriers, wholesalers, retailers, value-added
resellers, small and mid-sized businesses and education, enterprise and government customers. The Company generally does not require
collateral from its customers; however, the Company will require collateral in certain instances to limit credit risk. In addition, when possible, the
Company attempts to limit credit risk on trade receivables with credit insurance for certain customers or by requiring third-party financing, loans
or leases to support credit exposure. These credit-financing arrangements are directly between the third-party financing company and the end
customer. As such, the Company generally does not assume any recourse or credit risk sharing related to any of these arrangements.
As of September 26, 2015, the Company had one customer that represented 10% or more of total trade receivables, which accounted for
12%. As of September 27, 2014, the Company had two customers that represented 10% or more of total trade receivables, one of which
accounted for 16% and the other 13%. The Company’s cellular network carriers accounted for 71% and 72% of trade receivables as of
September 26, 2015 and September 27, 2014, respectively.
Vendor Non-Trade Receivables
The Company has non-trade receivables from certain of its manufacturing vendors resulting from the sale of components to these
vendors who manufacture sub-assemblies or assemble final products for the Company. The Company purchases these components
directly from suppliers. Vendor non-trade receivables from three of the Company’s vendors accounted for 38%, 18% and 14% of total
vendor non-trade receivables as of September 26, 2015 and three of the Company’s vendors accounted for 51%, 16% and 14% of total
vendor non-trade receivables as of September 27, 2014.
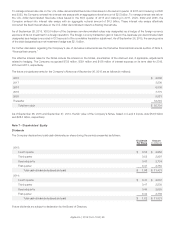
Note 3 – Consolidated Financial Statement Details
The following tables show the Company’s consolidated financial statement details as of September 26, 2015 and September 27, 2014 (in
millions):
Property, Plant and Equipment, Net
2015 2014
Land and buildings $ 6,956 $ 4,863
Machinery, equipment and internal-use software 37,038 29,639
Leasehold improvements 5,263 4,513
Gross property, plant and equipment 49,257 39,015
Accumulated depreciation and amortization (26,786) (18,391)
Total property, plant and equipment, net $ 22,471 $ 20,624
Apple Inc. | 2015 Form 10-K | 53