Apple 2015 Annual Report Download - page 69
Download and view the complete annual report
Please find page 69 of the 2015 Apple annual report below. You can navigate through the pages in the report by either clicking on the pages listed below, or by using the keyword search tool below to find specific information within the annual report.-
 1
1 -
2
-
3
-
4
-
5
-
6
-
7
-
8
-
9
-
10
-
11
-
12
-
13
-
14
-
15
-
16
-
17
-
18
-
19
-
20
-
21
-
22
-
23
-
24
-
25
-
26
-
27
-
28
-
29
-
30
-
31
-
32
-
33
-
34
-
35
-
36
-
37
-
38
-
39
-
40
-
41
-
42
-
43
-
44
-
45
-
46
-
47
-
48
-
49
-
50
-
51
-
52
-
53
-
54
-
55
-
56
-
57
-
58
-
 59
59 -
 60
60 -
 61
61 -
 62
62 -
 63
63 -
 64
64 -
 65
65 -
 66
66 -
 67
67 -
 68
68 -
 69
69 -
 70
70 -
 71
71 -
 72
72 -
 73
73 -
 74
74 -
 75
75 -
 76
76 -
 77
77 -
 78
78 -
 79
79 -
80
-
81
-
82
-
83
-
84
 |
 |

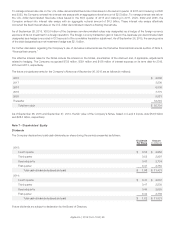
The following table shows information by reportable operating segment for 2015, 2014 and 2013 (in millions):
2015 2014 2013
Americas:
Net sales $ 93,864 $ 80,095 $ 77,093
Operating income $ 31,186 $ 26,158 $ 24,829
Europe:
Net sales $ 50,337 $ 44,285 $ 40,980
Operating income $ 16,527 $ 14,434 $ 12,767
Greater China:
Net sales $ 58,715 $ 31,853 $ 27,016
Operating income $ 23,002 $ 11,039 $ 8,499
Japan:
Net sales $ 15,706 $ 15,314 $ 13,782
Operating income $ 7,617 $ 6,904 $ 6,668
Rest of Asia Pacific:
Net sales $ 15,093 $ 11,248 $ 12,039
Operating income $ 5,518 $ 3,674 $ 3,762
A reconciliation of the Company’s segment operating income to the Consolidated Statements of Operations for 2015, 2014 and 2013 is
as follows (in millions):
2015 2014 2013
Segment operating income $ 83,850 $ 62,209 $ 56,525
Research and development expense (8,067) (6,041) (4,475)
Other corporate expenses, net (4,553) (3,665) (3,051)
Total operating income $ 71,230 $ 52,503 $ 48,999
The U.S. and China were the only countries that accounted for more than 10% of the Company’s net sales in 2015, 2014 and 2013.
There was no single customer that accounted for more than 10% of net sales in 2015, 2014 or 2013. Net sales for 2015, 2014 and 2013
and long-lived assets as of September 26, 2015 and September 27, 2014 are as follows (in millions):
2015 2014 2013
Net sales:
U.S. $ 81,732 $ 68,909 $ 66,197
China (1) 56,547 30,638 25,946
Other countries 95,436 83,248 78,767
Total net sales $ 233,715 $ 182,795 $ 170,910
2015 2014
Long-lived assets:
U.S. $ 12,022 $ 9,108
China (1) 8,722 9,477
Other countries 3,040 2,917
Total long-lived assets $ 23,784 $ 21,502
(1) China includes Hong Kong. Long-lived assets located in China consist primarily of product tooling and manufacturing process
equipment and assets related to retail stores and related infrastructure.
Apple Inc. | 2015 Form 10-K | 67