Kohl's 2009 Annual Report Download - page 20
Download and view the complete annual report
Please find page 20 of the 2009 Kohl's annual report below. You can navigate through the pages in the report by either clicking on the pages listed below, or by using the keyword search tool below to find specific information within the annual report.-
 1
1 -
2
-
3
-
4
-
5
-
6
-
7
-
8
-
9
-
 10
10 -
 11
11 -
 12
12 -
 13
13 -
 14
14 -
 15
15 -
 16
16 -
 17
17 -
 18
18 -
 19
19 -
 20
20 -
 21
21 -
 22
22 -
 23
23 -
 24
24 -
 25
25 -
 26
26 -
 27
27 -
 28
28 -
 29
29 -
 30
30 -
31
-
32
-
33
-
34
-
35
-
36
-
37
-
38
-
39
-
40
-
41
-
42
-
43
-
44
-
45
-
46
-
47
-
48
-
49
-
50
-
51
-
52
-
53
-
54
-
55
-
56
-
57
-
58
-
59
-
60
-
61
-
62
-
63
-
64
-
65
-
66
-
67
-
68
-
69
-
70
-
71
-
72
-
73
 |
 |
Table of Contents
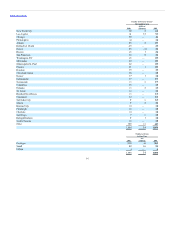
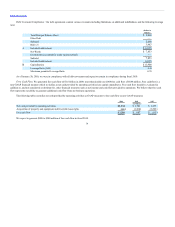
The selected consolidated financial data presented below should be read in conjunction with our consolidated financial statements and related notes
included elsewhere in this document. The Statement of Income and Balance Sheet Data have been derived from our audited consolidated financial statements.
Net sales $16,389 $ 16,474 $15,597 $13,444
Cost of merchandise sold 10,334 10,460 9,922 8,664
Gross margin 6,055 6,014 5,675 4,780
Selling, general and administrative expenses 3,936 3,697 3,422 2,981
Depreciation and amortization 541 452 388 339
Preopening expenses 42 61 50 44
Operating income 1,536 1,804 1,815 1,416
Interest expense, net 111 62 41 70
Income before income taxes 1,425 1,742 1,774 1,346
Provision for income taxes 540 658 665 504
Net income $885 $1,084 $1,109 $842
Net income per share:
Basic $2.89 $3.41 $3.34 $ 2.45
Diluted $2.89 $3.39 $3.31 $2.43
Comparable store sales growth (a) (6.9%) (0.8%) 5.9% 3.4%
Net sales per selling square foot (b) $ 222 $ 249 $256 $252
Total square feet of selling space
(end of period, in thousands) 74,992 69,889 62,357 56,625
Number of stores open
(end of period) 1,004 929 817 732
Return on average shareholders’ equity (c) 14.0% 18.5% 19.5% 15.5%
Working capital $ 1,884 $1,952 $ 1,481 $2,520
Property and equipment, net 6,984 6,510 5,353 4,616
Total assets 11,363 10,575 9,046 9,146
Long-term debt and capital leases 2,053 2,052 1,040 1,046
Shareholders’ equity 6,739 6,102 5,603 5,956
(a) Comparable store sales growth is based on sales for stores (including e-commerce sales and relocated or expanded stores) which were open throughout
both the full current and prior year periods. Fiscal 2006 was a 53-week year. Comparable store sales growth for 2006 is presented for the 52-weeks
ended January 27, 2007 and excludes approximately $200 million in sales which were earned in the 53 week of that year.
(b) Net sales per selling square foot is based on stores open for the full current period, excluding e-commerce. Fiscal 2006 excludes the impact of the 53
week.
(c) Average shareholders’ equity is based on a 5-quarter average.
20
rd
rd