Kohl's 2009 Annual Report Download - page 26
Download and view the complete annual report
Please find page 26 of the 2009 Kohl's annual report below. You can navigate through the pages in the report by either clicking on the pages listed below, or by using the keyword search tool below to find specific information within the annual report.-
 1
1 -
2
-
3
-
4
-
5
-
6
-
7
-
8
-
9
-
10
-
11
-
12
-
13
-
14
-
15
-
 16
16 -
 17
17 -
 18
18 -
 19
19 -
 20
20 -
 21
21 -
 22
22 -
 23
23 -
 24
24 -
 25
25 -
 26
26 -
 27
27 -
 28
28 -
 29
29 -
 30
30 -
 31
31 -
 32
32 -
 33
33 -
 34
34 -
 35
35 -
 36
36 -
37
-
38
-
39
-
40
-
41
-
42
-
43
-
44
-
45
-
46
-
47
-
48
-
49
-
50
-
51
-
52
-
53
-
54
-
55
-
56
-
57
-
58
-
59
-
60
-
61
-
62
-
63
-
64
-
65
-
66
-
67
-
68
-
69
-
70
-
71
-
72
-
73
 |
 |

Table of Contents
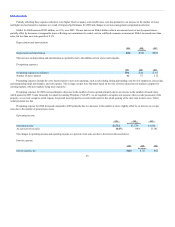
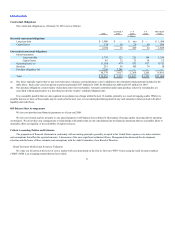
Net interest expense for 2009 increased $13 million, or 12%, over 2008. The increase is attributable to lower interest income due to lower interest rates on
our investments, partially offset by higher average investments. A reduction in capitalized interest due to lower capital expenditures in 2009 also contributed to
the increase in interest expense.
Net interest expense for 2008 increased $49 million, or 79%, over 2007 primarily due to $1 billion in new debt that was issued in September 2007.
Reductions in capitalized interest due to lower capital expenditures also contributed to the increase.
Income taxes.
Provision for income taxes $540 $658
Effective tax rate 37.9% 37.8%
The effective tax rate for 2009 was comparable to the 2008 and 2007 tax rates.
Although we expect that our operating results will be influenced by general economic conditions, including fluctuations in food, fuel and energy prices,
we do not believe that inflation has had a material effect on our results of operations during the periods presented. However, there can be no assurance that our
business will not be affected by inflation in the future.
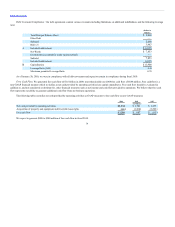
Our primary ongoing cash requirements are for capital expenditures in connection with our expansion and remodeling programs and seasonal and new
store inventory purchases. Our primary sources of funds are cash flow provided by operations, short-term trade credit and our lines of credit. Short-term trade
credit, in the form of extended payment terms for inventory purchases, represents a significant source of financing for merchandise inventories. Seasonal cash
needs may be met by the line of credit available under our revolving credit facility. Our working capital and inventory levels typically build throughout the
fall, peaking during the November and December holiday selling season.
We anticipate that we will be able to satisfy our working capital requirements, planned capital expenditures and debt service requirements with available
cash and cash equivalents, proceeds from cash flows from operations, short-term trade credit, seasonal borrowings under our revolving credit facility and
other sources of financing. We expect to generate adequate cash flow from operating activities to sustain current levels of operations.
As of January 30, 2010, we had cash and cash equivalents of $2.3 billion. We generated $1.6 billion of free cash flow in 2009 and expect to generate
$800 to $900 million in 2010. (See the Free Cash Flow discussion later in this Liquidity and Capital Resources section for additional discussion of free cash
flow, a non-GAAP financial measure.)
We have no debt maturing prior to 2011. We expect to use cash and cash equivalents on hand and funds from operations to repay both the $300 million
of long-term debt which is due in March 2011 and the $100 million of long-term debt which is due in October 2011.
In the first quarter of 2006, we sold our proprietary credit card accounts and entered into a service and revenue-sharing agreement with JPMorgan Chase.
This agreement will expire in April 2011. We are currently
26