Kohl's 2009 Annual Report Download - page 29
Download and view the complete annual report
Please find page 29 of the 2009 Kohl's annual report below. You can navigate through the pages in the report by either clicking on the pages listed below, or by using the keyword search tool below to find specific information within the annual report.-
 1
1 -
2
-
3
-
4
-
5
-
6
-
7
-
8
-
9
-
10
-
11
-
12
-
13
-
14
-
15
-
16
-
17
-
18
-
 19
19 -
 20
20 -
 21
21 -
 22
22 -
 23
23 -
 24
24 -
 25
25 -
 26
26 -
 27
27 -
 28
28 -
 29
29 -
 30
30 -
 31
31 -
 32
32 -
 33
33 -
 34
34 -
 35
35 -
 36
36 -
 37
37 -
 38
38 -
 39
39 -
40
-
41
-
42
-
43
-
44
-
45
-
46
-
47
-
48
-
49
-
50
-
51
-
52
-
53
-
54
-
55
-
56
-
57
-
58
-
59
-
60
-
61
-
62
-
63
-
64
-
65
-
66
-
67
-
68
-
69
-
70
-
71
-
72
-
73
 |
 |

Table of Contents
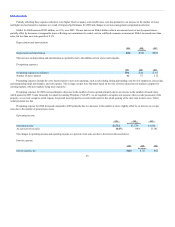
Financing activities.
Our financing activities provided cash of $30 million in 2009 compared to using $273 million in 2008. The change is primarily due to treasury stock
purchases in the first six months of 2008.
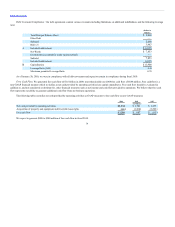
We have no debt maturing until 2011. We expect to use cash on hand and funds from operations to repay both the $300 million of long-term debt which
is due in March 2011 and the $100 million of long-term debt which is due in October 2011.
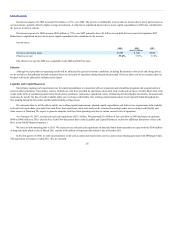
Our credit ratings have been unchanged since September 2007 when we issued $1 billion in debt. Our ratings are currently as follows:
Long-term debt Baa1 BBB+ BBB+
We may from time to time seek to retire or purchase our outstanding debt through open market cash purchases, privately negotiated transactions or
otherwise. Such repurchases, if any, will depend on prevailing market conditions, our liquidity requirements, contractual restrictions and other factors. The
amounts involved could be material. In September 2007, our Board of Directors authorized a $2.5 billion share repurchase program which is intended to
return excess capital to our shareholders. As a result of the current economic environment, we have not purchased any shares under this program since July
2008. In 2008, we repurchased 6.0 million shares at a total cost of $261 million. The program does not have a specified termination date.
Our financing activities used cash of $273 million in 2008 and provided cash of $325 million in 2007. The change reflects the proceeds from the
issuance of $1 billion of debt in 2007 and lower treasury stock purchases in 2008.
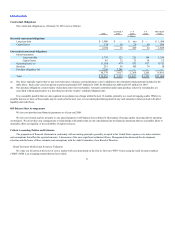
Key financial ratios.
Key financial ratios that provide certain measures of our liquidity are as follows:
Working capital (In Millions) $ 1,884 $1,952
Current ratio 2.02:1 2.09:1
Debt/capitalization 23.5% 25.3%
Ratio of earnings to fixed charges 4.47 5.97
The increase in working capital and the current ratio as of year-end 2009 compared to year-end 2008 was primarily due to higher cash and cash
equivalents. The decrease in the debt/capitalization ratio reflects higher capitalization, primarily due to earnings. The ratio of earnings to fixed charges was
comparable to 2008. See Exhibit 12.1 to this Annual Report on Form 10-K for the calculation of this ratio.
The decreases in working capital and the current ratio as of year-end 2008 compared to year-end 2007 were primarily due to lower inventory levels and a
higher accounts payable balance. The debt/capitalization ratio reflects higher capitalization at year-end 2008 compared to year-end 2007 due to current year
earnings. The decrease in the earnings to fixed charges ratio was the result of lower income before taxes and higher interest expense on our debt due to the $1
billion in debt that was issued in September 2007.
29