Kohl's 2009 Annual Report Download - page 22
Download and view the complete annual report
Please find page 22 of the 2009 Kohl's annual report below. You can navigate through the pages in the report by either clicking on the pages listed below, or by using the keyword search tool below to find specific information within the annual report.-
 1
1 -
2
-
3
-
4
-
5
-
6
-
7
-
8
-
9
-
10
-
11
-
 12
12 -
 13
13 -
 14
14 -
 15
15 -
 16
16 -
 17
17 -
 18
18 -
 19
19 -
 20
20 -
 21
21 -
 22
22 -
 23
23 -
 24
24 -
 25
25 -
 26
26 -
 27
27 -
 28
28 -
 29
29 -
 30
30 -
 31
31 -
 32
32 -
33
-
34
-
35
-
36
-
37
-
38
-
39
-
40
-
41
-
42
-
43
-
44
-
45
-
46
-
47
-
48
-
49
-
50
-
51
-
52
-
53
-
54
-
55
-
56
-
57
-
58
-
59
-
60
-
61
-
62
-
63
-
64
-
65
-
66
-
67
-
68
-
69
-
70
-
71
-
72
-
73
 |
 |

Table of Contents
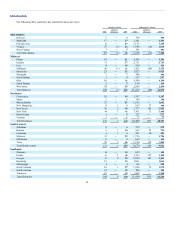
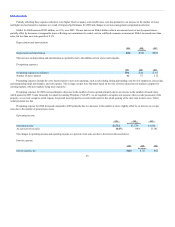
Net sales.
Net sales (in millions) $16,389 $16,474
Number of stores:
Open at end of period 1,004 929
Comparable stores (a) 817 732
Sales growth:
All stores (0.5%) 5.6%
Comparable stores (a) (6.9%) (0.8%)
Net sales per selling square foot (b) $ 222 $ 249
(a) Comparable store sales growth is based on sales for stores (including e-commerce sales and relocated or expanded stores) which were open throughout
both the full current and prior year periods.
(b) Net sales per selling square foot is based on stores open for the full current period, excluding e-commerce.
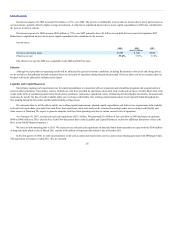
Net sales for 2009 increased $789 million, or 4.8%, over 2008. New stores contributed $719 million to the increase in net sales over the prior year.
Comparable store sales increased $70 million. We opened 56 new stores in 2009, 75 stores in 2008 and 112 stores in 2007. As we open new stores, especially
in existing markets, sales may be transferred from existing stores. We estimate that opening new stores in existing markets negatively impacted comparable
store sales by approximately 1% in 2009.
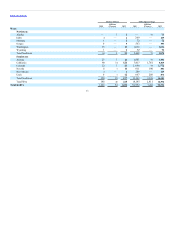
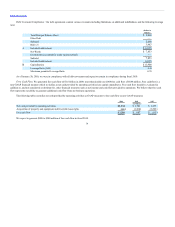
Drivers of the changes in comparable stores sales were as follows:
Selling price per unit 1.9% (0.3)%
Units per transaction (2.9) 0.9
Average transaction value (1.0) 0.6
Number of transactions (5.9) (1.4)
Comparable store sales (6.9)% (0.8)%
Net sales, especially in the Southwest region, were favorably impacted by the closure of Mervyn’s department stores. We continue to aggressively pursue
former Mervyn’s customers through increased advertising efforts and targeted efforts in stores most likely to benefit from former Mervyn’s customers. In these
stores, we have increased staffing levels and provided higher inventory levels and wider assortments in selected categories. We estimate that the Mervyn’s
closure increased our comparable store sales by approximately 140 basis points for the year.
The Southwest region reported the strongest 2009 sales growth with comparable store sales increases in the high single digits. We expect to continue to
produce strong results in the Southwest in 2010, but we believe our other hot and mild regions will benefit more substantially in 2010 from the merchandising
and marketing tactics we developed in 2009 in the Southwest.
Lower units per transaction resulted in negative comparable store sales in all regions other than the Southwest and Northwest.
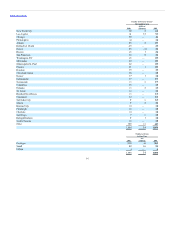
By line of business, Accessories, Footwear and Home outperformed our comparable store sales for the year. Accessories was led by strength in sterling
silver jewelry, fashion jewelry, and handbags. In Footwear, women’s, athletic and children’s shoes performed best. Home was strong in small electrics,
bedding and bath. Men’s was similar to the company average and was led by active, basics and casual sportswear. Children’s and Women’s were below the
company average. The Children’s business had strength in toys, infants/toddlers and boys.
22