Kohl's 2009 Annual Report Download - page 21
Download and view the complete annual report
Please find page 21 of the 2009 Kohl's annual report below. You can navigate through the pages in the report by either clicking on the pages listed below, or by using the keyword search tool below to find specific information within the annual report.-
 1
1 -
2
-
3
-
4
-
5
-
6
-
7
-
8
-
9
-
10
-
 11
11 -
 12
12 -
 13
13 -
 14
14 -
 15
15 -
 16
16 -
 17
17 -
 18
18 -
 19
19 -
 20
20 -
 21
21 -
 22
22 -
 23
23 -
 24
24 -
 25
25 -
 26
26 -
 27
27 -
 28
28 -
 29
29 -
 30
30 -
 31
31 -
32
-
33
-
34
-
35
-
36
-
37
-
38
-
39
-
40
-
41
-
42
-
43
-
44
-
45
-
46
-
47
-
48
-
49
-
50
-
51
-
52
-
53
-
54
-
55
-
56
-
57
-
58
-
59
-
60
-
61
-
62
-
63
-
64
-
65
-
66
-
67
-
68
-
69
-
70
-
71
-
72
-
73
 |
 |

Table of Contents
The current economic slowdown has caused disruptions and significant volatility in financial markets, increased rates of mortgage loan default and
personal bankruptcy, and declining consumer and business confidence, which has led to decreased levels of consumer spending, particularly on discretionary
items. Though we have seen some improvement throughout 2009, as evidenced by increases in our comparable store sales, we believe that our core customer
continues to face economic challenges which will result in a very competitive 2010.
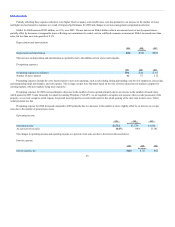
Total net sales for 2009 were $17.2 billion, a 4.8% increase from 2008. Comparable store sales increased 0.4% over 2008. The Southwest region and the
Accessories business reported the strongest comparable store sales growth.
Gross margin as a percent of net sales for the year increased approximately 88 basis points over the 2008 rate to 37.8%. Strong inventory management as
well as increased penetration of private and exclusive brands contributed to the margin strength. Ending inventory per store (in dollars) decreased 0.9%
compared to 2008.
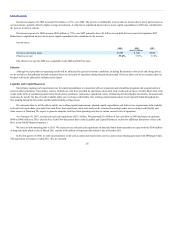
Selling, general and administrative expenses (“SG&A”) increased approximately 5% compared to the prior year. SG&A as a percentage of net sales,
increased, or “deleveraged” primarily due to increased incentive compensation and changes made to our non-management compensation structure. SG&A
expenses for the year increased at a rate faster than sales, but at a rate slower than new store growth of 5.5%. Our cost control initiatives are focused on
sustainable productivity improvements, not one-time cutting of expenses. While we will continue to look for ways to become more efficient, we intend to keep
the customer experience in our stores a priority in order to provide consistency across our stores and intend to continue to invest more in store payroll to
improve our customer service.
Net income increased approximately 12% for 2009 to $991 million, or $3.23 per diluted share, compared to $885 million, or $2.89 per diluted share
for 2008.
We ended the year with 1,058 stores in 49 states, including 56 which were successfully opened in 2009. We completed 51 store remodels, compared to
36 stores last year. In fiscal 2010, we expect to open approximately 30 stores and remodel 85 stores. Remodels remain a critical part of our long-term strategy as
we believe it is extremely important to maintain our existing store base, even in this difficult economic environment.
Our current expectations for fiscal 2010 assume that consumer spending will continue to be weak throughout 2010. We expect comparable store sales
will be driven by increased market share as we expect average transaction value to remain under pressure. Our current expectations for both the first quarter
and fiscal 2010 compared to comparable fiscal 2009 periods are as follows:
• Total sales increase of 4% to 6%
• Comparable store sales increase of 1% to 3%
• Gross margin increase of 20 to 30 basis points
• SG&A dollars to increase 4% to 5%
• Earnings per diluted share of $0.48 to $0.52 for the first quarter of 2010 and $3.40 to $3.63 for fiscal 2010.
Our fiscal year ends on the Saturday closest to January 31. Unless otherwise noted, references to years in this report relate to fiscal years, rather than to
calendar years. Fiscal year 2009 (“2009”) ended on January 30, 2010, fiscal year 2008 (“2008”) ended on January 31, 2009 and fiscal year 2007 (“2007”)
ended on February 2, 2008. All three years were 52-week years.
21