Kohl's 2009 Annual Report Download - page 61
Download and view the complete annual report
Please find page 61 of the 2009 Kohl's annual report below. You can navigate through the pages in the report by either clicking on the pages listed below, or by using the keyword search tool below to find specific information within the annual report.-
 1
1 -
2
-
3
-
4
-
5
-
6
-
7
-
8
-
9
-
10
-
11
-
12
-
13
-
14
-
15
-
16
-
17
-
18
-
19
-
20
-
21
-
22
-
23
-
24
-
25
-
26
-
27
-
28
-
29
-
30
-
31
-
32
-
33
-
34
-
35
-
36
-
37
-
38
-
39
-
40
-
41
-
42
-
43
-
44
-
45
-
46
-
47
-
48
-
49
-
50
-
 51
51 -
 52
52 -
 53
53 -
 54
54 -
 55
55 -
 56
56 -
 57
57 -
 58
58 -
 59
59 -
 60
60 -
 61
61 -
 62
62 -
 63
63 -
 64
64 -
 65
65 -
 66
66 -
 67
67 -
 68
68 -
 69
69 -
 70
70 -
 71
71 -
72
-
73
 |
 |

Table of Contents
The dividend yield represents the expected dividends on our stock for the expected term of the option. The expected volatility assumption is based on the
historical volatility of our stock. The risk-free interest rate for periods within the life of the option is based on a blend of U.S. Treasury bond rates. We use
historical data to estimate the expected life of the option and the period of time that options granted are expected to be outstanding.
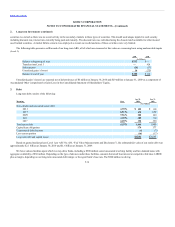
The following table summarizes our stock option activity for 2009, 2008, and 2007:
Balance at beginning of year 17,313 $55.79 15,226 $ 49.21
Granted 3,568 41.93 5,079 72.29
Forfeited/expired (1,612) 59.37 (852) 60.55
Exercised (135) 40.87 (2,140) 46.21
Balance at end of year 19,134 $53.01 17,313 $55.79
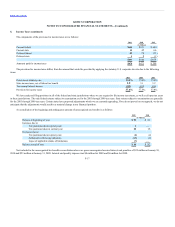
The intrinsic value of options exercised represents the excess of our stock price at the time the option was exercised over the exercise price and was $20
million in 2009, $1 million in 2008 and $58 million in 2007.
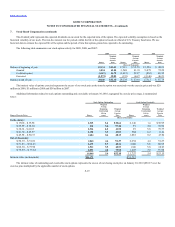
Additional information related to stock options outstanding and exercisable at January 30, 2010, segregated by exercise price range, is summarized
below:
$ 17.00 – $ 35.50 2,146 3.0 $ 30.95
$ 35.59 – $ 38.30 59
5.0 36.94
$ 38.34 – $ 41.63 29 5.8 39.77
$ 41.70 – $ 45.57 584 6.2 43.04
$ 45.58 – $ 50.37 1,892 9.2 47.90
$ 50.39 – $ 51.81 2,254 4.8 51.27
$ 51.83 – $ 66.25 2,000 5.8 60.95
$ 66.30 – $ 75.90 1,300 5.8 68.03
$ 75.95 – $ 77.62 1,493 3.9 75.98
11,757 5.4 $53.15
Intrinsic value (in thousands) $51,712
The intrinsic value of outstanding and exercisable stock options represents the excess of our closing stock price on January 30, 2010 ($50.37) over the
exercise price multiplied by the applicable number of stock options.
F-19