LabCorp 2008 Annual Report Download - page 20
Download and view the complete annual report
Please find page 20 of the 2008 LabCorp annual report below. You can navigate through the pages in the report by either clicking on the pages listed below, or by using the keyword search tool below to find specific information within the annual report.-
 1
1 -
2
-
3
-
4
-
5
-
6
-
7
-
8
-
9
-
 10
10 -
 11
11 -
 12
12 -
 13
13 -
 14
14 -
 15
15 -
 16
16 -
 17
17 -
 18
18 -
 19
19 -
 20
20 -
 21
21 -
 22
22 -
 23
23 -
 24
24 -
 25
25 -
 26
26 -
 27
27 -
 28
28 -
 29
29 -
 30
30 -
31
-
32
-
33
-
34
-
35
-
36
-
37
-
38
-
39
-
40
-
41
-
42
-
43
-
44
-
45
-
46
-
47
-
48
-
49
-
50
-
51
-
52
-
53
-
54
-
55
-
56
-
57
-
58
 |
 |

Laboratory Corporation of America
18 Laboratory Corporation of America® Holdings 2008
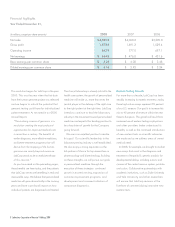
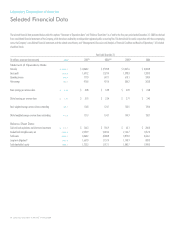
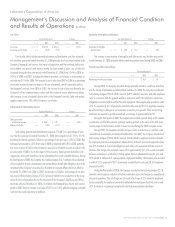
Selected Financial Data
The selected financial data presented below under the captions “Statement of Operations Data” and “Balance Sheet Data” as of and for the five-year period ended December 31, 2008 are derived
from consolidated financial statements of the Company, which have been audited by an independent registered public accounting firm. This data should be read in conjunction with the accompanying
notes, the Company’s consolidated financial statements and the related notes thereto, and “Management’s Discussion and Analysis of Financial Condition and Results of Operations,” all included
elsewhere herein.
Year Ended December 31,
(In millions, except per share amounts) 2008(a) 2007(b) 2006(c)(d) 2005(e) 2004
Statement of Operations Data:
Net sales $ 4,505.2 $ 4,068.2 $ 3,590.8 $ 3,327.6 $ 3,084.8
Gross profit 1,873.8 1,691.2 1,529.4 1,390.3 1,289.3
Operating income 842.9 777.0 697.1 618.1 598.4
Net earnings 464.5 476.8 431.6 386.2 363.0
Basic earnings per common share $ 4.23 $ 4.08 $ 3.48 $ 2.89 $ 2.60
Diluted earnings per common share $ 4.16 $ 3.93 $ 3.24 $ 2.71 $ 2.45
Basic weighted average common shares outstanding 109.7 116.8 124.1 133.5 139.4
Diluted weighted average common shares outstanding 111.8 121.3 134.7 144.9 150.7
Balance Sheet Data:
Cash and cash equivalents, and short-term investments $ 219.7 $ 166.3 $ 186.9 $ 63.1 $ 206.8
Goodwill and intangible assets, net 2,994.8 2,252.9 2,094.2 2,122.7 1,857.4
Total assets 4,669.5 4,368.2 4,000.8 3,875.8 3,626.1
Long-term obligations(f)
1,721.3 1,667.0 1,157.4 1,148.9 889.3
Total shareholders’ equity 1,688.3 1,725.3 1,977.1 1,885.7 1,999.3