LabCorp 2008 Annual Report Download - page 53
Download and view the complete annual report
Please find page 53 of the 2008 LabCorp annual report below. You can navigate through the pages in the report by either clicking on the pages listed below, or by using the keyword search tool below to find specific information within the annual report.-
 1
1 -
2
-
3
-
4
-
5
-
6
-
7
-
8
-
9
-
10
-
11
-
12
-
13
-
14
-
15
-
16
-
17
-
18
-
19
-
20
-
21
-
22
-
23
-
24
-
25
-
26
-
27
-
28
-
29
-
30
-
31
-
32
-
33
-
34
-
35
-
36
-
37
-
38
-
39
-
40
-
41
-
42
-
 43
43 -
 44
44 -
 45
45 -
 46
46 -
 47
47 -
 48
48 -
 49
49 -
 50
50 -
 51
51 -
 52
52 -
 53
53 -
 54
54 -
 55
55 -
 56
56 -
 57
57 -
 58
58
 |
 |

Notes to Consolidated Financial Statements
(Dollars and shares in millions, except per share data)
Laboratory Corporation of America
Laboratory Corporation of America® Holdings 2008 51
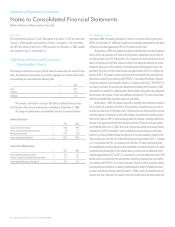
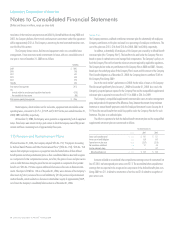
A summary of the changes in the projected benefit obligations of the defined benefit
retirement plan and the nonqualified supplemental retirement plan are summarized as follows:
2008 2007
Balance at January 1 $ 287.2 $ 278.5
Service cost 20.0 19.1
Interest cost 17.2 16.0
Actuarial gain (11.8) (2.2)
Amendments 4.6 –
Benefits and administrative expenses paid (26.2) (24.2)
Executive retirement charge 1.7 –
Balance at December 31 $ 292.7 $ 287.2
The Accumulated Benefit Obligation was $288.6 and $283.0 at December 31, 2008
and 2007, respectively.
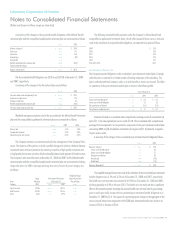
A summary of the changes in the fair value of plan assets follows:
2008 2007
Fair value of plan assets at beginning of year $ 270.7 $ 274.7
Actual return on plan assets (75.1) 19.5
Employer contributions 0.7 0.7
Benefits and administrative expenses paid (26.2) (24.2)
Fair value of plan assets at end of year $ 170.1 $ 270.7
Weighted average assumptions used in the accounting for the defined benefit retirement
plan and the nonqualified supplemental retirement plan are summarized as follows:
2008 2007 2006
Discount rate 6.5% 6.1% 6.0%
Compensation increases 3.5% 3.5% 3.0%
Expected long term rate of return 8.5% 8.5% 8.5%
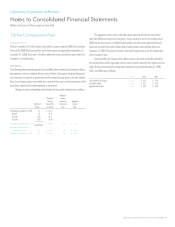
The Company maintains an investment policy for the management of the Company Plan’s
assets. The objective of this policy is to build a portfolio designed to achieve a balance between
investment return and asset protection by investing in equities of high quality companies and
in high quality fixed income securities which are broadly balanced and represent all market sectors.
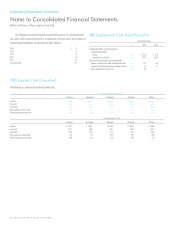
The Company’s plan asset allocations at December 31, 2008 and 2007 for the defined benefit
retirement plan and the nonqualified supplemental retirement plan are summarized as follows,
target allocation for 2009, and expected long-term rate of return by asset category are
as follows:
Weighted Average
Target Percentage of Plan Assets Expected Long-Term
Asset Allocation at December 31, Rate of Return
Category 2009 2008 2007 2008
Equity Securities 70.0% 53.5% 69.5% 6.8%
Debt Securities 30.0% 46.5% 29.6% 1.7%
Other 0.0% 0.0% 0.9% 0.0%
The following assumed benefit payments under the Company’s defined benefit and
nonqualified supplemental retirement plans, which reflect expected future service, and were
used in the calculation of projected benefit obligations, are expected to be paid as follows:
2009 $ 22.0
2010 24.0
2011 23.4
2012 27.0
2013 29.1
Years 2014-2018 162.7
Post-Retirement Medical Plan
The Company assumed obligations under a subsidiary’s post-retirement medical plan. Coverage
under this plan is restricted to a limited number of existing employees of the subsidiary. This
plan is unfunded and the Company’s policy is to fund benefits as claims are incurred. The effect
on operations of the post-retirement medical plan is shown in the following table:
Year End December 31,
2008 2007 2006
Service cost for benefits earned $ 0.4 $ 0.5 $ 0.6
Interest cost on benefit obligation 2.7 2.7 2.2
Net amortization and deferral (1.7) (2.1) (2.1)
Post-retirement medical plan costs $ 1.4 $ 1.1 $ 0.7
Amounts included in accumulated other comprehensive earnings consist of unamortized net
gain of $7.1 and unrecognized prior service credit of $2.0. The accumulated other comprehensive
earnings that are expected to be recognized as components of the post-retirement medical plan
costs during 2009 are ($0.4) related to amortization of net gain and ($1.3) related to recognition
of prior service credits.
A summary of the changes in the accumulated post-retirement benefit obligation follows:
2008 2007
Balance at January 1 $ 42.8 $ 45.8
Service cost for benefits earned 0.4 0.5
Interest cost on benefit obligation 2.7 2.7
Participants contributions 0.3 0.3
Actuarial gain (7.9) (5.0)
Benefits paid (1.6) (1.5)
Balance at December 31 $ 36.7 $ 42.8
The weighted-average discount rates used in the calculation of the accumulated post-retirement
benefit obligation was 6.5% and 6.2% as of December 31, 2008 and 2007, respectively.
The health care cost trend rate was assumed to be 9.0% as of December 31, 2008 and 2007,
declining gradually to 5.0% in the year 2013. The health care cost trend rate has a significant
effect on the amounts reported. Increasing the assumed health care cost trend rates by a percentage
point in each year would increase the accumulated post-retirement benefit obligation as of
December 31, 2008 by $5.4. The impact of a percentage point change on the aggregate of the
service cost and interest cost components of the 2008 post-retirement benefit costs results in an
increase of $0.5 or decrease of $0.4.