LabCorp 2008 Annual Report Download - page 43
Download and view the complete annual report
Please find page 43 of the 2008 LabCorp annual report below. You can navigate through the pages in the report by either clicking on the pages listed below, or by using the keyword search tool below to find specific information within the annual report.-
 1
1 -
2
-
3
-
4
-
5
-
6
-
7
-
8
-
9
-
10
-
11
-
12
-
13
-
14
-
15
-
16
-
17
-
18
-
19
-
20
-
21
-
22
-
23
-
24
-
25
-
26
-
27
-
28
-
29
-
30
-
31
-
32
-
 33
33 -
 34
34 -
 35
35 -
 36
36 -
 37
37 -
 38
38 -
 39
39 -
 40
40 -
 41
41 -
 42
42 -
 43
43 -
 44
44 -
 45
45 -
 46
46 -
 47
47 -
 48
48 -
 49
49 -
 50
50 -
 51
51 -
 52
52 -
 53
53 -
54
-
55
-
56
-
57
-
58
 |
 |

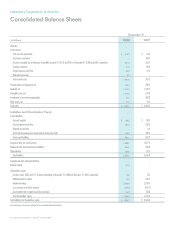
Notes to Consolidated Financial Statements
(Dollars and shares in millions, except per share data)
Laboratory Corporation of America
Laboratory Corporation of America® Holdings 2008 41
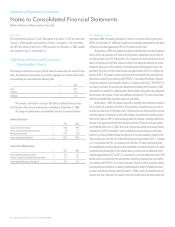
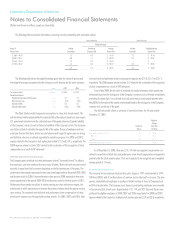
Condensed unconsolidated financial information for joint venture partnerships is shown
in the following table (the Ontario, Canada joint venture information included for the 2007 and
2006 information only).
2008 2007
As of December 31:
Current assets $ 28.5 $ 65.9
Other assets 31.4 169.9
Total assets $ 59.9 $ 235.8
Current liabilities $ 18.7 $ 29.5
Other liabilities 2.5 0.1
Total liabilities 21.2 29.6
Partners’ equity 38.7 206.2
Total liabilities and Partners equity $ 59.9 $ 235.8
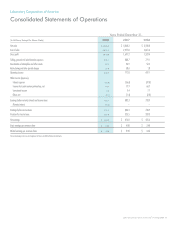
2008 2007 2006
For the period January 1 – December 31:
Net sales $ 182.0 $ 403.4 $ 361.7
Gross profit 69.0 190.9 165.3
Net earnings 34.3 120.9 102.0
The Company’s recorded investment in the Alberta joint venture partnership at December 31,
2008 includes $52.8 of value assigned to the partnership’s Canadian licenses (with an indefinite
life and deductible for tax) to conduct diagnostic testing services in the province.
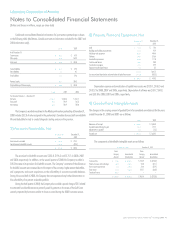
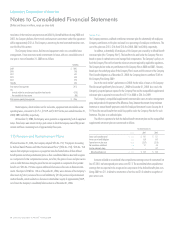
7) Accounts Receivable, Net
December 31, December 31,
2008 2007
Gross accounts receivable $ 792.6 $ 715.7
Less allowance for doubtful accounts (161.0) (92.5)
$ 631.6 $ 623.2
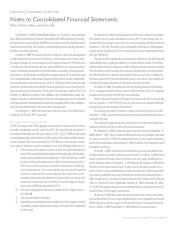
The provision for doubtful accounts was $232.8, $196.2 and $176.5 in 2008, 2007
and 2006 respectively. In addition, in the second quarter of 2008 the Company recorded a
$45.0 increase in its provision for doubtful accounts. The Company’s estimate of the allowance
for doubtful accounts was increased due to the impact of the economy, higher patient deductibles
and copayments, and recent acquisitions on the collectibility of accounts receivable balances.
During the second half of 2008, the Company has not experienced any further deterioration in
the collectibility of its patient receivable portfolio.
During the third quarter of 2008, the Company also recorded a special charge of $5.5 related
to estimated uncollectible amounts primarily owed by patients in the areas of the Gulf Coast
severely impacted by hurricanes similar to losses incurred during the 2005 hurricane season.
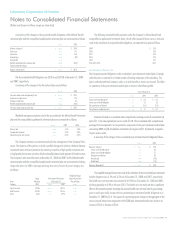
8) Property, Plant and Equipment, Net
December 31, December 31,
2008 2007
Land $ 20.6 $ 19.6
Buildings and building improvements 115.2 95.9
Machinery and equipment 558.9 484.4
Software 278.9 256.4
Leasehold improvements 127.9 111.8
Furniture and fixtures 44.6 30.0
Construction in progress 57.1 59.9
Equipment under capital leases 3.5 3.5
1,206.7 1,061.5
Less accumulated depreciation and amortization of capital lease assets (710.3) (622.3)
$ 496.4 $ 439.2
Depreciation expense and amortization of capital lease assets was $120.1, $106.5 and
$102.2 for 2008, 2007 and 2006, respectively. Depreciation of software was $33.7, $34.8,
and $33.8 for 2008, 2007 and 2006, respectively.
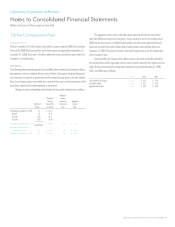
9) Goodwill and Intangible Assets
The changes in the carrying amount of goodwill (net of accumulated amortization) for the years
ended December 31, 2008 and 2007 are as follows:
2008 2007
Balance as of January 1 $ 1,639.5 $ 1,484.0
Goodwill acquired during the year 135.4 157.7
Adjustments to goodwill (2.7) (2.2)
Goodwill, net $ 1,772.2 $ 1,639.5
The components of identifiable intangible assets are as follows:
December 31, 2008 December 31, 2007
Gross Gross
Carrying Accumulated Carrying Accumulated
Amount Amortization Amount Amortization
Customer lists $ 793.2 $ (294.1) $ 734.9 $ (253.0)
Patents, licenses and technology 94.7 (54.2) 94.0 (47.1)
Non-compete agreements 37.0 (28.2) 34.4 (25.9)
Trade name 115.3 (33.4) 102.1 (26.0)
Canadian licenses 592.3 – – –
$ 1,632.5 $ (409.9) $ 965.4 $ (352.0)