LabCorp 2008 Annual Report Download - page 39
Download and view the complete annual report
Please find page 39 of the 2008 LabCorp annual report below. You can navigate through the pages in the report by either clicking on the pages listed below, or by using the keyword search tool below to find specific information within the annual report.-
 1
1 -
2
-
3
-
4
-
5
-
6
-
7
-
8
-
9
-
10
-
11
-
12
-
13
-
14
-
15
-
16
-
17
-
18
-
19
-
20
-
21
-
22
-
23
-
24
-
25
-
26
-
27
-
28
-
 29
29 -
 30
30 -
 31
31 -
 32
32 -
 33
33 -
 34
34 -
 35
35 -
 36
36 -
 37
37 -
 38
38 -
 39
39 -
 40
40 -
 41
41 -
 42
42 -
 43
43 -
 44
44 -
 45
45 -
 46
46 -
 47
47 -
 48
48 -
 49
49 -
50
-
51
-
52
-
53
-
54
-
55
-
56
-
57
-
58
 |
 |

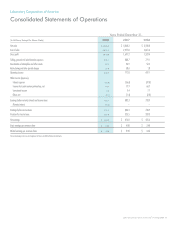
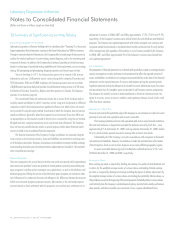
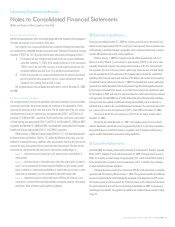
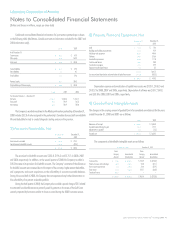
Notes to Consolidated Financial Statements
(Dollars and shares in millions, except per share data)
Laboratory Corporation of America
Laboratory Corporation of America® Holdings 2008 37
Stock Compensation Plans
The Company accounts for stock compensation expense in accordance with Statement of
Financial Accounting Standards No. 123 (revised 2004), Share-Based Payment (“SFAS 123(R)”),
which requires measurement of compensation cost for all equity awards at fair value on the
date of grant and recognition of compensation over the service period for awards expected to
vest. The fair value of restricted stock awards and performance shares is determined based on
the number of shares granted and the quoted price of the Company’s common stock. Such value
is recognized as expense over the service period, net of estimated forfeitures. The estimation of
equity awards that will ultimately vest requires judgment, and to the extent actual results or
updated estimates differ from the Company’s current estimates, such amounts will be recorded
as a cumulative adjustment in the period estimates are revised. The Company considers many
factors when estimating expected forfeitures, including types of awards, employee class, and
historical experience. Actual results and future estimates may differ substantially from the
Company’s current estimates.
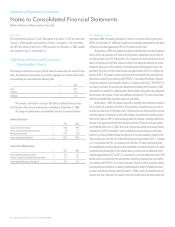
The following table summarizes the components of the Company’s stock-based compensation expense for the years ended December 31, 2008, 2007, and 2006:
2008 2007 2006
Pre-Tax Tax Pre-Tax Tax Pre-Tax Tax
Expense Benefit Net Expense Benefit Net Expense Benefit Net
Stock option and stock purchase plans $ 20.0 $ (8.0) $ 12.0 $ 18.0 $ (7.2) $ 10.8 $ 23.3 $ (9.4) $ 13.9
Restricted stock and performance share awards 14.2 (5.7) 8.5 17.4 (7.0) 10.4 17.7 (7.1) 10.6
Executive retirement charge 2.0 (0.8) 1.2 – – – 11.6 (4.6) 7.0
Total share based compensation $ 36.2 $ (14.5) $ 21.7 $ 35.4 $ (14.2) $ 21.2 $ 52.6 $ (21.1) $ 31.5
During the fourth quarter of 2008, the Company recorded charges of approximately
$2.0, related to the acceleration of the recognition of stock compensation due to the retirement
of the Company’s Executive Vice President of Corporate Affairs, effective December 31, 2008.
During the second half of 2006, the Company recorded charges of approximately $11.6,
related to the acceleration of the recognition of stock compensation due to the retirement of the
Company’s Chief Executive Officer, effective December 31, 2006.
See note 15 for assumptions used in calculating compensation expense for the Company’s
stock compensation plans.
Cash Equivalents
Cash equivalents (primarily investments in money market funds, time deposits, municipal,
treasury and government funds which have original maturities of three months or less at the
date of purchase) are carried at cost which approximates market.
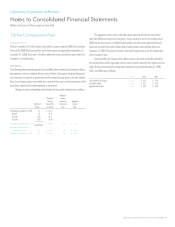
The following represents a reconciliation of basic earnings per share to diluted earnings per share:
2008 2007 2006
Per Share Per Share Per Share
Income Shares Amount Income Shares Amount Income Shares Amount
Basic earnings per share $ 464.5 109.7 $ 4.23 $ 476.8 116.8 $ 4.08 $ 431.6 124.1 $3.48
Stock options – 0.7 – 1.2 – 1.3
Restricted stock awards and other – 0.3 – 0.8 – 0.7
Effect of convertible debt, net of tax – 1.1 – 2.5 5.3 8.6
Diluted earnings per share $ 464.5 111.8 $ 4.16 $ 476.8 121.3 $ 3.93 $ 436.9 134.7 $ 3.24
The following table summarizes the potential common shares not included in the computation of diluted earnings per share because their impact would have been antidilutive:
Years Ended December 31,
2008 2007 2006
Stock options 2.4 1.2 1.1