Starbucks 2008 Annual Report Download - page 2
Download and view the complete annual report
Please find page 2 of the 2008 Starbucks annual report below. You can navigate through the pages in the report by either clicking on the pages listed below, or by using the keyword search tool below to find specific information within the annual report.-
 1
1 -
 2
2 -
 3
3 -
 4
4 -
 5
5 -
 6
6 -
 7
7 -
 8
8 -
 9
9 -
 10
10 -
 11
11 -
 12
12 -
 13
13 -
14
-
15
-
16
-
17
-
18
-
19
-
20
-
21
-
22
-
23
-
24
-
25
-
26
-
27
-
28
-
29
-
30
-
31
-
32
-
33
-
34
-
35
-
36
-
37
-
38
-
39
-
40
-
41
-
42
-
43
-
44
-
45
-
46
-
47
-
48
-
49
-
50
-
51
-
52
-
53
-
54
-
55
-
56
-
57
-
58
-
59
-
60
-
61
-
62
-
63
-
64
-
65
-
66
-
67
-
68
-
69
-
70
-
71
-
72
-
73
-
74
-
75
-
76
-
77
-
78
-
79
-
80
-
81
-
82
-
83
-
84
-
85
-
86
-
87
-
88
-
89
-
90
-
91
-
92
-
93
-
94
-
95
 |
 |

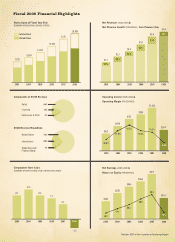
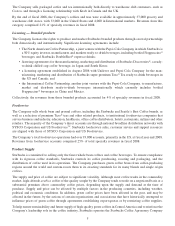
$564
$494
$389
$265
Net Earnings (IN MILLIONS) &
Return on Equity (PERCENTAGES)
14%
$673
$315*
Fiscal 2008 Financial Highlights
Stores Open at Fiscal Year End
(COMPANY-OPERATED AND LICENSED STORES)
International
United States
2003 2004 2005 2006 2007 2003 2004 2005 2006 2007
$7.8
$6.4
$5.3
$4.1
24%
30%
20%
22%
Net Revenues (IN BILLIONS) &
Net Revenue Growth (PERCENTAGES) from Previous Year
Components of 2008 Revenue
Retail
Licensing
Foodservice & Other
84%
12%
4%
United States
International
Global Consumer
Products Group
76%
20%
4%
2003 2004 2005 2006
$894
$781
$606
$421
Operating Income (IN MILLIONS) &
Operating Margin (PERCENTAGES)
Comparable Store Sales
(COMPANY-OPERATED STORES OPEN 13 MONTHS OR LONGER)
2003 2004 2005 2006
2008 Revenue Breakdown
8%
10%
7%
2003 2004 2005 2006
10.3%
11.5%
12.3%
11.5%
17%
20%
25%
15,011
2008 2008
$9.4
21%
2007
$1,054
2007
5%
2007
11.2 %
7,225
8,569
10,241
12,440
8%
16,680 $10.4
10%
2008
$504*
4.9%
– 3%
2008
13%
*Includes $267 million in pretax restructuring charges
2008
29%