Starbucks 2008 Annual Report Download - page 8
Download and view the complete annual report
Please find page 8 of the 2008 Starbucks annual report below. You can navigate through the pages in the report by either clicking on the pages listed below, or by using the keyword search tool below to find specific information within the annual report.-
 1
1 -
 2
2 -
 3
3 -
 4
4 -
 5
5 -
 6
6 -
 7
7 -
 8
8 -
 9
9 -
 10
10 -
 11
11 -
 12
12 -
 13
13 -
 14
14 -
 15
15 -
 16
16 -
 17
17 -
 18
18 -
 19
19 -
20
-
21
-
22
-
23
-
24
-
25
-
26
-
27
-
28
-
29
-
30
-
31
-
32
-
33
-
34
-
35
-
36
-
37
-
38
-
39
-
40
-
41
-
42
-
43
-
44
-
45
-
46
-
47
-
48
-
49
-
50
-
51
-
52
-
53
-
54
-
55
-
56
-
57
-
58
-
59
-
60
-
61
-
62
-
63
-
64
-
65
-
66
-
67
-
68
-
69
-
70
-
71
-
72
-
73
-
74
-
75
-
76
-
77
-
78
-
79
-
80
-
81
-
82
-
83
-
84
-
85
-
86
-
87
-
88
-
89
-
90
-
91
-
92
-
93
-
94
-
95
 |
 |

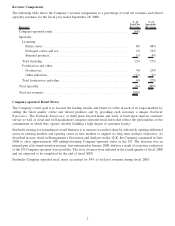
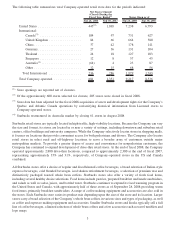
Revenue Components
The following table shows the Company’s revenue components as a percentage of total net revenues and related
specialty revenues for the fiscal year ended September 28, 2008:
Revenues
%of
Total Net
Revenues
%of
Specialty
Revenues
Company-operated retail ......................................... 84%
Specialty:
Licensing:
Retail stores .............................................. 8% 48%
Packaged coffee and tea ...................................... 3% 21%
Branded products ........................................... 1% 4%
Total licensing............................................... 12% 73%
Foodservice and other:
Foodservice ............................................... 4% 25%
Other initiatives ............................................ ⬍1% 2%
Total foodservice and other ..................................... 4% 27%
Total specialty . ............................................... 16% 100%
Total net revenues .............................................. 100%
Company-operated Retail Stores
The Company’s retail goal is to become the leading retailer and brand of coffee in each of its target markets by
selling the finest quality coffee and related products and by providing each customer a unique Starbucks
Experience. The Starbucks Experience, or third place beyond home and work, is built upon superior customer
service as well as clean and well-maintained Company-operated retail stores that reflect the personalities of the
communities in which they operate, thereby building a high degree of customer loyalty.
Starbucks strategy for expanding its retail business is to increase its market share by selectively opening additional
stores in existing markets and opening stores in new markets to support its long term strategic objectives. As
described in more detail in Management’s Discussion and Analysis in this 10-K, the Company committed in June
2008 to close approximately 600 underperforming Company-operated stores in the US. The decision was an
integral part of its transformation strategy, first announced in January 2008, and was a result of a rigorous evaluation
of the US Company-operated store portfolio. The store closures were initiated in the fourth quarter of fiscal 2008
and are expected to be completed by the end of fiscal 2009.
Starbucks Company-operated retail stores accounted for 84% of total net revenues during fiscal 2008.
2