Walgreens 2004 Annual Report Download - page 15
Download and view the complete annual report
Please find page 15 of the 2004 Walgreens annual report below. You can navigate through the pages in the report by either clicking on the pages listed below, or by using the keyword search tool below to find specific information within the annual report.-
 1
1 -
2
-
3
-
4
-
 5
5 -
 6
6 -
 7
7 -
 8
8 -
 9
9 -
 10
10 -
 11
11 -
 12
12 -
 13
13 -
 14
14 -
 15
15 -
 16
16 -
 17
17 -
 18
18 -
 19
19 -
 20
20 -
 21
21 -
 22
22 -
 23
23 -
 24
24 -
 25
25 -
26
-
27
-
28
-
29
-
30
-
31
-
32
-
33
-
34
-
35
-
36
-
37
-
38
-
39
-
40
-
41
-
42
-
43
-
44
-
45
-
46
-
47
-
48
-
49
-
50
-
51
-
52
-
53
 |
 |

15
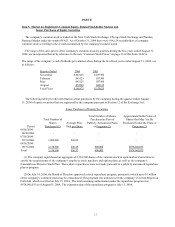
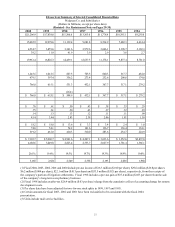
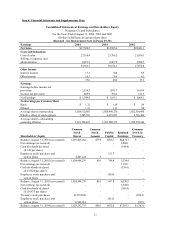
Eleven-Year Summary of Selected Consolidated Financial Data
Walgreen Co. and Subsidiaries
(Dollars in Millions, except per share data)
(Restated - See Restatement Note on Pages 29-30)
2000 1999 1998 1997 1996 1995 1994
$21,206.9
$17,838.8
$15,306.6
$13,363.0
$11,778.4
$10,395.1
$9,235.0
15,465.9
12,978.6
11,139.4
9,681.8
8,514.9
7,482.3
6,614.4
4,534.7
3,859.6
3,341.6
2,979.6
2,666.1
2,398.7
2,169.3
39.2
11.9
41.9
3.9
2.9
3.6
2.7
19,961.4
16,826.3
14,439.1
12,657.5
11,178.1
9,877.4
8,781.0
1,245.5
1,012.5
867.5
705.5
600.3
517.7
454.0
479.5
397.4
336.2
273.4
232.6
200.6
174.8
766.0
615.1
531.3
432.1
367.7
317.1
279.2
-
- (26.4)
-
-
-
-
$ 766.0
$ 615.1
$ 504.9
$ 432.1
$ 367.7
$ 317.1
$ 279.2
$ .76
$ .61
$ .50
$ .43
$ .38
$ .33
$ .29
.75
.61
.50
.43
.37
.32
.29
.14
.13
.13
.12
.11
.11
.09
4.14
3.44
2.83
2.38
2.06
1.81
1.59
$ 18.2
$ 18.0
$ 13.6
$ 3.3
$ 3.4
$ 2.4
$ 1.8
74.0
54.1
74.2
101.6
136.7
136.4
134.1
519.2
461.0
410.3
310.0
283.6
254.7
224.9
$ 7,103.7
$ 5,906.7
$ 4,901.6
$ 4,207.1
$ 3,633.6
$ 3,252.6
$2,872.8
4,188.6
3,449.8
2,823.4
2,353.7
2,027.9
1,781.4
1,566.1
20.1%
19.6%
19.5%
19.7%
19.3%
18.9%
19.0%
3,165
2,821
2,549
2,358
2,193
2,085
1,968
(1) Fiscal 2004, 2003, 2002, 2001 and 2000 include pre-tax income of $16.3 million ($.010 per share), $29.6 million ($.018 per share),
$6.2 million ($.004 per share), $22.1 million ($.013 per share) and $33.5 million ($.021 per share), respectively, from the receipts of
the company’ s portion of litigation settlements. Fiscal 1998 includes a pre-tax gain of $37.4 million ($.023 per share) from the sale
of the company’ s long-term care pharmacy business.
(2) Fiscal 1998 includes an after-
tax $26.4 million ($.03 per share) charge from the cumulative effect of accounting change for system
development costs.
(3) Per share data have been adjusted for two-for-one stock splits in 1999, 1997 and 1995.
(4) Certain amounts for fiscal 2003, 2002 and 2001 have been reclassified to be consistent with the fiscal 2004
presentation.
(5) Units include mail service facilities.