Walgreens 2004 Annual Report Download - page 18
Download and view the complete annual report
Please find page 18 of the 2004 Walgreens annual report below. You can navigate through the pages in the report by either clicking on the pages listed below, or by using the keyword search tool below to find specific information within the annual report.-
 1
1 -
2
-
3
-
4
-
5
-
6
-
7
-
 8
8 -
 9
9 -
 10
10 -
 11
11 -
 12
12 -
 13
13 -
 14
14 -
 15
15 -
 16
16 -
 17
17 -
 18
18 -
 19
19 -
 20
20 -
 21
21 -
 22
22 -
 23
23 -
 24
24 -
 25
25 -
 26
26 -
 27
27 -
 28
28 -
29
-
30
-
31
-
32
-
33
-
34
-
35
-
36
-
37
-
38
-
39
-
40
-
41
-
42
-
43
-
44
-
45
-
46
-
47
-
48
-
49
-
50
-
51
-
52
-
53
 |
 |
18
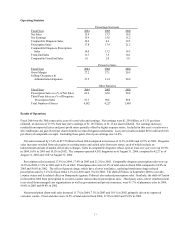
Gross margins as a percent of total sales were 27.2% in 2004, 27.1% in 2003 and 26.5% in 2002. Both prescription and front-end
margins increased in fiscal 2004. Prescription margins increased primarily because of higher generic drug utilization. Partially
offsetting these increases was the shift in sales mix toward prescriptions, which carry a lower margin than front-end merchandise.
In addition, third party sales, which typically have lower profit margins than cash prescriptions, continue to become a larger
portion of prescription sales. Non-prescription margins increased due to our sales mix moving to higher margin categories,
especially digital film processing. Contributing to the fiscal 2003 increase was the shift in vendor allowances from advertising to
cost of sales. As of January 2003, we adopted Emerging Issues Task Force (EITF) Issue No. 02-16, “Accounting by a Customer
(including a Reseller) for Certain Consideration Received from a Vendor.” The impact of EITF Issue No. 02-16 in fiscal 2003
resulted in an increase to advertising costs of $75.0 million (.23% of total sales), a reduction to cost of sales of $56.2 million (.17%
of total sales), and a reduction to pre-tax earnings and inventory of $18.8 million.
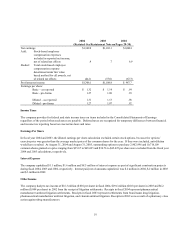
We use the last-in, first-out (LIFO) method of inventory valuation. The LIFO provision is dependent upon inventory levels,
inflation rates and merchandise mix. The effective LIFO inflation rates were .14% in 2004, .84% in 2003 and 1.42% in 2002, which
resulted in charges to cost of sales of $6.7 million in 2004, $36.2 million in 2003 and $55.9 million in 2002. Inflation on prescription
inventory was .7% in 2004, 3.8% in 2003 and 4.3% in 2002. In all three fiscal years, we experienced some deflation in non-
prescription inventories.
Selling, occupancy and administration expenses were 21.5% of sales in fiscal 2004, 21.4% in fiscal 2003 and 20.9% in fiscal 2002.
The increase in fiscal 2004, as a percent to sales, was caused by higher advertising costs as well as costs associated with our
ongoing conversion from analog to digital photo labs. Lower sales as a result of new generic drugs also increased expense ratios
in 2004 and 2003. In addition, fiscal 2003 was affected by the shift in vendor allowances from advertising to cost of sales, as well as
higher store salaries and occupancy as a percent to sales.
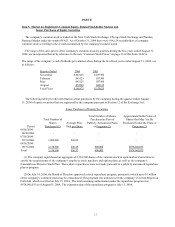
Interest income increased in 2004 pri
ncipally due to higher investment levels. Average net investment levels were approximately
$1.281 billion in 2004, $631 million in 2003 and $162 million in 2002.
The effective income tax rate was 37.5% for fiscal 2004 and 37.75% for both 2003 and 2002.
Critical Accounting Policies
The consolidated financial statements are prepared in accordance with accounting principles generally accepted in the United
States of America and include amounts based on management’ s prudent judgments and estimates. Actual results may differ from
these estimates. Management believes that any reasonable deviation from these judgments and estimates would not have a
material impact on the consolidated financial position or results of operations. To the extent that the estimates used differ from
actual results, however, adjustments to the statement of earnings and corresponding balance sheet accounts would be necessary.
These adjustments would be made in future statements. Some of the more significant estimates include liability for closed
locations, liability for insurance claims, vendor allowances, allowance for doubtful accounts and cost of sales. We use the
following techniques to determine estimates:
Liability for closed locations -
The present value of future rent obligations and other related costs (net of estimated sublease rent) to
the first lease option date.
Liability for insurance claims –
Provisions for these losses are recorded based upon estimates for claims incurred. The provisions are
estimated in part by considering historical claims experience, demographic factors and other actuarial
assumptions.
Vendor allowances –
Vendor allowances are principally received as a result of purchase levels, sales or promotion of vendors'
products. Allowances are generally recorded as a reduction of inventory and are recognized as a
reduction of cost of sales when the related merchandise is sold. Those allowances received for
promoting vendors’ products are offset against advertising expense and result in a reduction of selling,
occupancy and administration expense to the extent of advertising incurred, with the excess treated as a
reduction of inventory costs.