Walgreens 2004 Annual Report Download - page 36
Download and view the complete annual report
Please find page 36 of the 2004 Walgreens annual report below. You can navigate through the pages in the report by either clicking on the pages listed below, or by using the keyword search tool below to find specific information within the annual report.-
 1
1 -
2
-
3
-
4
-
5
-
6
-
7
-
8
-
9
-
10
-
11
-
12
-
13
-
14
-
15
-
16
-
17
-
18
-
19
-
20
-
21
-
22
-
23
-
24
-
25
-
 26
26 -
 27
27 -
 28
28 -
 29
29 -
 30
30 -
 31
31 -
 32
32 -
 33
33 -
 34
34 -
 35
35 -
 36
36 -
 37
37 -
 38
38 -
 39
39 -
 40
40 -
 41
41 -
 42
42 -
 43
43 -
 44
44 -
 45
45 -
 46
46 -
47
-
48
-
49
-
50
-
51
-
52
-
53
 |
 |

36
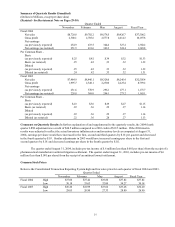
Summary of Quarterly Results (Unaudited)
(Dollars in Millions, except per share data)
(Restated - See Restatement Note on Pages 29-30)
Quarter Ended
November February May August Fiscal Year
Fiscal 2004
Net sales $8,720.8 $9,782.2
$9,578.5
$9,426.7 $37,508.2
Gross profit 2,300.1 2,705.6
2,577.8
2,614.3 10,197.8
Net earnings
(as previously reported) 254.9 433.5
344.6
327.2 1,360.2
Net earnings (as restated) 251.5 431.6
342.3
324.4 1,349.8
Per Common Share -
Basic
(as previously reported) $.25 $.42
$.34
$.32 $1.33
Basic (as restated) .25 .42
.33
.32 1.32
Diluted
(as previously reported) .25 .42
.33
.32 1.32
Diluted (as restated) .24 .42
.33
.32 1.31
Fiscal 2003
Net sales $7,484.9 $8,446.1
$8,328.0
$8,246.4 $32,505.4
Gross profit 1,995.7 2,348.1
2,230.0
2,225.4 8,799.2
Net earnings
(as previously reported) 231.6 370.9
296.1
277.1 1,175.7
Net earnings (as restated) 228.8 369.0
294.1
273.2 1,165.1
Per Common Share -
Basic
(as previously reported) $.23 $.36
$.29
$.27 $1.15
Basic (as restated) .22 .36
.29
.27 1.14
Diluted
(as previously reported) .22 .36
.29
.27 1.14
Diluted (as restated) .22 .36
.28
.27 1.13
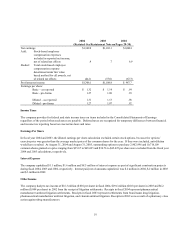
Comments on Quarterly Results: In further explanation of and supplemental to the quarterly results, the 2004 fourth
quarter LIFO adjustment was a credit of $48.5 million compared to a 2003 credit of $19.5 million. If the 2004 interim
results were adjusted to reflect the actual inventory inflation rates and inventory levels as computed at August 31,
2004, earnings per share would have increased in the first, second and third quarters by $.01 per quarter and decreased
in the fourth quarter by $.03. Similar adjustments in 2003 would have increased earnings per share in the first and
second quarters by $.01 and decreased earnings per share in the fourth quarter by $.02.
The quarter ended August 31, 2004, includes pre-tax income of $.6 million (less than $.001 per share) from the receipt of a
pharmaceutical manufacturer antitrust litigation settlement. The quarter ended August 31, 2003, includes pre-tax income of $.6
million (less than $.001 per share) from the receipt of an antitrust lawsuit settlement.
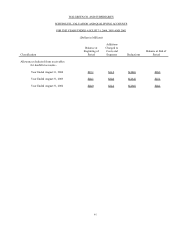
Common Stock Prices
Below is the Consolidated Transaction Reporting System high and low sales price for each quarter of fiscal 2004 and 2003.
Quarter Ended
November February May August Fiscal Year
Fiscal 2004 High $37.00
$37.42
$35.80
$37.82
$37.82
Low 30.18
33.63
32.00
34.27
30.18
Fiscal 2003 High $36.20
$32.99
$33.66
$33.28
$36.20
Low 28.05
26.90
27.33
28.80
26.90