Walgreens 2004 Annual Report Download - page 17
Download and view the complete annual report
Please find page 17 of the 2004 Walgreens annual report below. You can navigate through the pages in the report by either clicking on the pages listed below, or by using the keyword search tool below to find specific information within the annual report.-
 1
1 -
2
-
3
-
4
-
5
-
6
-
 7
7 -
 8
8 -
 9
9 -
 10
10 -
 11
11 -
 12
12 -
 13
13 -
 14
14 -
 15
15 -
 16
16 -
 17
17 -
 18
18 -
 19
19 -
 20
20 -
 21
21 -
 22
22 -
 23
23 -
 24
24 -
 25
25 -
 26
26 -
 27
27 -
28
-
29
-
30
-
31
-
32
-
33
-
34
-
35
-
36
-
37
-
38
-
39
-
40
-
41
-
42
-
43
-
44
-
45
-
46
-
47
-
48
-
49
-
50
-
51
-
52
-
53
 |
 |

17
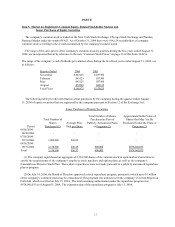
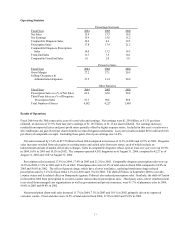
Operating Statistics
Percentage Increases
Fiscal Year 2004 2003 2002
Net Sales 15.4 13.3 16.5
Net Earnings 15.9 15.6 15.2
Comparable Drugstore Sales 10.9 8.6 10.5
Prescription Sales 17.8 17.4 21.2
Comparable Drugstore Prescription
Sales 14.0 13.2 16.3
Front-End Sales 11.7 7.5 10.1
Comparable Front-End Sales 6.1 2.0 3.0
Percent to Sales
Fiscal Year 2004 2003 2002
Gross Margin 27.2 27.1 26.5
Selling, Occupancy &
Administration Expenses 21.5 21.4 20.9
Other Statistics
Fiscal Year 2004 2003 2002
Prescription Sales as a % of Net Sales 63.2 62.0 59.8
Third Party Sales as a % of Drugstore
Prescription Sales 91.7 90.6 89.8
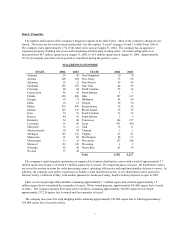
Total Number of Stores 4,582 4,227 3,883
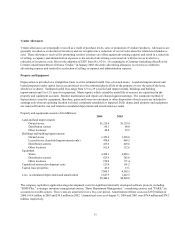
Results of Operations
Fiscal 2004 was the 30th consecutive year of record sales and earnings. Net earnings were $1.350 billion, or $1.31 per share
(diluted), an increase of 15.9% from last year's earnings of $1.165 billion, or $1.13 per share (diluted). Net earnings increases
resulted from improved sales and gross profit ratios partially offset by higher expense ratios. Included in this year’ s results was a
$16.3 million pre-tax gain ($.010 per share) from the receipt of litigation settlements. Last year's results included $29.6 million ($.018
per share) of comparable receipts. Excluding these gains, fiscal year earnings rose 16.8%.
Net sales increased by 15.4% to $37.5 billion in fiscal 2004 compared to increases of 13.3% in 2003 and 16.5% in 2002. Drugstore
sales increases resulted from sales gains in existing stores and added sales from new stores, each of which include an
indeterminate amount of market-driven price changes. Sales in comparable drugstore (those open at least one year) were up 10.9%
in 2004, 8.6% in 2003 and 10.5% in 2002. The company operated 4,582 drugstores as of August 31, 2004, compared to 4,227 as of
August 31, 2003 and 3,883 at August 31, 2002.
Prescription sales increased 17.8% in 2004, 17.4% in 2003 and 21.2% in 2002. Comparable drugstore prescription sales were up
14.0% in 2004, 13.2% in 2003 and 16.3% in 2002. Prescription sales were 63.2% of total sales for fiscal 2004 compared to 62.0% in
2003 and 59.8% in 2002. The effect of generic drugs, which have a lower retail price, replacing brand name drugs reduced
prescription sales by 1.2% for fiscal 2004, 2.1% for 2003 and 1.5% for 2002. The shift of Prilosec in September 2003 to over-the-
counter status and its related effect on Omeprazole (generic Prilosec) also reduced prescription sales. Similarly, the shift of Claritin
in December 2002 from prescription to over-the-counter status reduced prescription sales. Third party sales, where reimbursement
is received from managed care organizations as well as government and private insurance, were 91.7% of pharmacy sales in 2004,
90.6% in 2003 and 89.8% in 2002.
Non-prescription (front-end) sales increased 11.7% in 2004, 7.5% in 2003 and 10.1% in 2002, primarily driven by improved
customer counts. Front-end sales were 36.5% of total sales in fiscal 2004, 37.8% in 2003 and 39.8% in 2002.