Walgreens 2004 Annual Report Download - page 19
Download and view the complete annual report
Please find page 19 of the 2004 Walgreens annual report below. You can navigate through the pages in the report by either clicking on the pages listed below, or by using the keyword search tool below to find specific information within the annual report.-
 1
1 -
2
-
3
-
4
-
5
-
6
-
7
-
8
-
 9
9 -
 10
10 -
 11
11 -
 12
12 -
 13
13 -
 14
14 -
 15
15 -
 16
16 -
 17
17 -
 18
18 -
 19
19 -
 20
20 -
 21
21 -
 22
22 -
 23
23 -
 24
24 -
 25
25 -
 26
26 -
 27
27 -
 28
28 -
 29
29 -
30
-
31
-
32
-
33
-
34
-
35
-
36
-
37
-
38
-
39
-
40
-
41
-
42
-
43
-
44
-
45
-
46
-
47
-
48
-
49
-
50
-
51
-
52
-
53
 |
 |
19
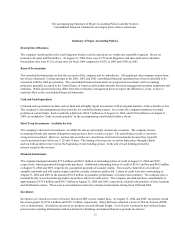
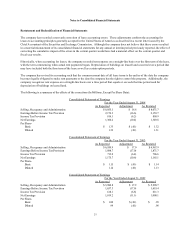
Allowance for doubtful accounts –
Based on both specific receivables and historic write-off percentages.
Cost of sales –
Primarily derived based upon point-of-sale scanning information with an estimate for shrinkage and
adjusted based on periodic inventories.
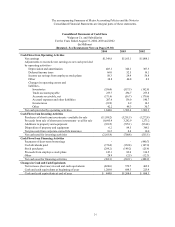
Liquidity and Capital Resources
Cash and cash equivalents were $444.0 million at August 31, 2004, compared to $1.268 billion at August 31, 2003. Short-term
investment objectives are to minimize risk, maintain liquidity and maximize after-tax yields. To attain these objectives, investment
limits are placed on the amount, type and issuer of securities. Investments are principally in top-tier money market funds and
commercial paper.
Net cash provided by operating activities was $1.644 billion in fiscal 2004 and $1.503 billion in fiscal 2003. The increase was due
primarily to higher earnings, partially offset by higher accounts receivables that were affected by the timing of payment cycles.
Our profitability is the principal source of funds for expansion and remodeling programs, dividends to shareholders, the stock
repurchase program and various technological improvements.
Net cash used for investing activities was $2.166 billion versus $700.8 million last year. Investments in auction rate securities net
of redemptions used $1.244 billion over last year for the twelve month period. We actively invest in municipal bonds and student
obligations and purchase these securities at par. While the underlying security is issued as a long term investment, they typically
can be purchased and sold every 7, 28 and 35 days. The tra
ding of auction rate securities takes place through a dutch auction with
an interest rate reset at the beginning of each holding period. At the end of each holding period the interest is paid to the investor.
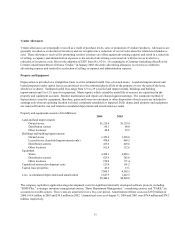
Additions to property and equipment were $939.5 million compared to $795.1 million last year. There were 446 new or relocated
stores, including seven home medical centers, three home infusion centers and two clinical pharmacies opened during the year.
This compared to 439 last year, which included nine home medical centers and two clinical pharmacies. New stores are owned or
leased. There were 46 owned locations opened during the year and 63 under construction at August 31, 2004, versus 54 owned
and 43 under construction as of August 31, 2003. During the year, a new distribution center opened in Moreno Valley, California.
Last year, a distribution center was opened in Perrysburg, Ohio.
Capital expenditures for fiscal 2005 are expected to be approximately $1.5 billion. Stores are expected to be 47% of this total,
distribution 15%, store technology 26% and other projects 12%. We expect to open about 450 new stores in fiscal 2005, with a net
increase of approximately 365 stores, and anticipate having a total of 7,000 drugstores by the year 2010. We are continuing to
relocate stores to more convenient and profitable freestanding locations. In addition to new stores, expenditures are planned for
technology and distribution centers. A new distribution center is planned for South Carolina with an anticipated opening date in
2007.
Net cash used for financing activities was $302.1 million compared to $222.1 million last year. On July 14, 2004, the Board of
Directors announced a stock repurchase program of up to $1 billion, which we plan to execute over the next four years. During
fiscal 2004 we purchased $21.9 million of company shares related to the stock repurchase program. An additional $277.3 million of
shares were purchased to support the long-term needs of the employee stock plans, which compares to similar purchases of $149.2
million last year. This year we had proceeds related to employee stock plans of $145.1 million versus $82.0 million last year. There
were no new borrowings or outstanding borrowings during either period. At August 31, 2004, we had a syndicated bank line of
credit facility of $200 million to support our short-term commercial paper program.