Walgreens 2004 Annual Report Download - page 25
Download and view the complete annual report
Please find page 25 of the 2004 Walgreens annual report below. You can navigate through the pages in the report by either clicking on the pages listed below, or by using the keyword search tool below to find specific information within the annual report.-
 1
1 -
2
-
3
-
4
-
5
-
6
-
7
-
8
-
9
-
10
-
11
-
12
-
13
-
14
-
 15
15 -
 16
16 -
 17
17 -
 18
18 -
 19
19 -
 20
20 -
 21
21 -
 22
22 -
 23
23 -
 24
24 -
 25
25 -
 26
26 -
 27
27 -
 28
28 -
 29
29 -
 30
30 -
 31
31 -
 32
32 -
 33
33 -
 34
34 -
 35
35 -
36
-
37
-
38
-
39
-
40
-
41
-
42
-
43
-
44
-
45
-
46
-
47
-
48
-
49
-
50
-
51
-
52
-
53
 |
 |
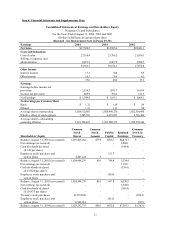
25
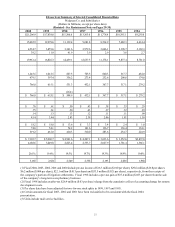
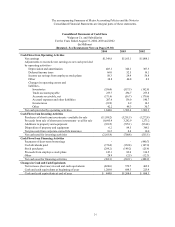
The accompanying Summary of Major Accounting Policies and the Notes to
Consolidated Financial Statements are integral parts of these statements.
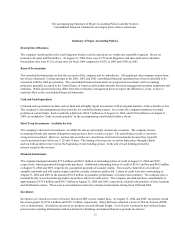
Summary of Major Accounting Policies
Description of Business
The company is principally in the retail drugstore business and its operations are within one reportable segment. Stores are
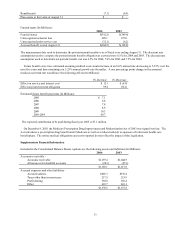
located in 44 states and Puerto Rico. At August 31, 2004, there were 4,579 retail drugstores and three mail service facilities.
Prescription sales were 63.2% of total sales for fiscal 2004 compared to 62.0% in 2003 and 59.8% in 2002.
Basis of Presentation
The consolidated statements include the accounts of the company and its subsidiaries. All significant intercompany transactions
have been eliminated. Certain amounts in the 2003, 2002 and 2001 consolidated financial statements have been reclassified to be
consistent with the 2004 presentation. The consolidated financial statements are prepared in accordance with accounting
principles generally accepted in the United States of America and include amounts based on management's prudent judgments and
estimates. While actual results may differ from these estimates, management does not expect the differences, if any, to have a
material effect on the consolidated financial statements.
Cash and Cash Equivalents
Cash and cash equivalents include cash on hand and all highly liquid investments with an original maturity of three months or less.
The company's cash management policy provides for controlled disbursement. As a result, the company maintains overdraft
positions at certain banks. Such overdrafts, which were $226.7 million as of August 31, 2004, and $330.8 million as of August 31,
2003, are included in "trade accounts payable" in the accompanying consolidated balance sheets.
Short Term Investments - Available for Sale
The company's short term investments - available for sale are principally auction rate securities. The company invests
in municipal bonds and student obligations and purchases these securities at par. The underlying security is issued as
a long term investment. However, auction rate securities are classified as short term investments because they typically
can be purchased and sold every 7, 28 and 35 days. The trading of auction rate securities takes place through a dutch
auction with an interest rate reset at the beginning of each holding period. At the end of each holding period the
interest is paid to the investor.
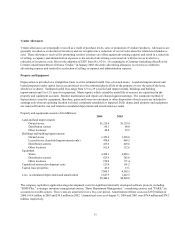
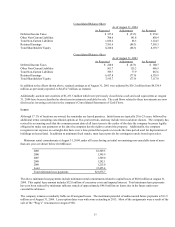
Financial Instruments
The company had approximately $77.2 million and $60.7 million of outstanding letters of credit at August 31, 2004 and 2003,
respectively, which guaranteed foreign trade purchases. Additional outstanding letters of credit of $156.2 million and $84.5 million
at August 31, 2004 and 2003, respectively, guaranteed payments of casualty claims. The casualty claim letters of credit are
annually renewable and will remain in place until the casualty claims are paid in full. Letters of credit were als o outstanding at
August 31, 2004 and 2003 in the amount of $1.6 million to guarantee performance of construction contracts. The company pays a
nominal facility fee to the financing bank to keep these letters of credit active. The company also had purchase commitments of
approximately $378.4 million and $245.7 million at August 31, 2004 and 2003, respectively, related to the purchase of store locations
and distribution centers. There were no investments in derivative financial instruments during fiscal 2004 and 2003.
Inventories
Inventories are valued on a lower of last-in, first-out (LIFO) cost or market basis. At August 31, 2004 and 2003, inventories would
have been greater by $736.4 million and $729.7 million, respectively, if they had been valued on a lower of first-in, first-out (FIFO)
cost or market basis. Included in inventory are product cost and inbound freight. Cost of sales is primarily derived based upon
point-of-sale scanning information with an estimate for shrinkage and adjusted based on periodic inventories.