Walgreens 2009 Annual Report Download - page 21
Download and view the complete annual report
Please find page 21 of the 2009 Walgreens annual report below. You can navigate through the pages in the report by either clicking on the pages listed below, or by using the keyword search tool below to find specific information within the annual report.-
 1
1 -
2
-
3
-
4
-
5
-
6
-
7
-
8
-
9
-
10
-
 11
11 -
 12
12 -
 13
13 -
 14
14 -
 15
15 -
 16
16 -
 17
17 -
 18
18 -
 19
19 -
 20
20 -
 21
21 -
 22
22 -
 23
23 -
 24
24 -
 25
25 -
 26
26 -
 27
27 -
 28
28 -
 29
29 -
 30
30 -
 31
31 -
32
-
33
-
34
-
35
-
36
-
37
-
38
-
39
-
40
-
41
-
42
 |
 |

include an indeterminate amount of market-driven price changes. Sales in compa-
rable drugstores were up 2.0% in 2009, 4.0% in 2008 and 8.1% in 2007.
Comparable drugstores are defined as those that have been open for at least
twelve consecutive months without closure for seven or more consecutive days
and without a major remodel or a natural disaster in the past twelve months.
Relocated and acquired stores are not included as comparable stores for the first
twelve months after the relocation or acquisition. We operated 7,496 locations
(6,997 drugstores) as of August 31, 2009, compared to 6,934 (6,443 drugstores)
at August 31, 2008, and 5,997 (5,882 drugstores) at August 31, 2007.
Prescription sales increased 7.8% in 2009, 9.7% in 2008 and 14.7% in 2007.
Comparable drugstore prescription sales were up 3.5% in 2009 compared to
increases of 3.9% in 2008 and 9.5% in 2007. Prescription sales as a percent of
total net sales were 65.3% in 2009, 64.9% in 2008 and 65.0% in 2007. The
effect of generic drugs introduced during the fiscal year, which replaced higher
priced retail brand name drugs, reduced prescription sales by 3.0% for 2009,
3.5% for 2008 and 4.2% for 2007, while the effect on total sales was 1.9% for
2009, 2.2% for 2008 and 2.5% for 2007. Third-party sales, where reimbursement
is received from managed care organizations, the government or private insurers,
were 95.4% of prescription sales in 2009, 95.3% in 2008 and 94.8% in 2007. The
total number of prescriptions filled was approximately651 million in 2009, 617 million
in 2008 and 583 million in 2007. Adjusted to 30-day equivalents, prescriptions filled
were 723 million in 2009, 677 million in 2008 and 636 million in 2007.
Front-end sales increased 6.3% in 2009, 10.0% in 2008 and 12.2% in 2007.
Front-end sales were 34.7% of total sales in fiscal 2009, 35.1% in 2008 and
35.0% in 2007. The increase is due in part to new store openings and improved
sales dollars related to non-prescription drugs, household items, convenience
foods, and personal care products. Comparable drugstore front-end sales
decreased 0.5% in 2009 compared to increases of 4.2% and 5.8% in fiscal years
2008 and 2007, respectively. The decrease in fiscal 2009 comparable front-end
sales was primarilydue to seasonal items and photofinishing.
Gross margin as a percent of sales decreased to 27.8% in 2009 from 28.2% in
2008. Overall margins were negatively impacted by non-retail businesses, including
specialty pharmacy, which have lower margins and are becoming a greater part of
the total business, lower front-end margins due to product mix, a higher provision
for LIFO and restructuring and restructuring related costs. This was partiallyoffset
by an improvement in retail pharmacy margins, which were positively influenced
by generic drug sales, but to a lesser extent negatively influenced by the growth
in third party pharmacy sales. Gross margin as a percent of sales was 28.2% in
2008 as compared to 28.4% in 2007. Overall margins were negatively impacted
by non-retail businesses, but partially offset by improvements in retail pharmacy
margins. Front-end margins remained essentially flat from 2007 as a positive shift
in sales mix was offset by increased promotions.
We use the last-in, first-out (LIFO) method of inventory valuation. The LIFO provision
is dependent upon inventory levels, inflation rates and merchandise mix. The effective
LIFO inflation rates were 2.00% in 2009, 1.28% in 2008 and 1.04% in 2007,
which resulted in charges to cost of sales of $172 million in 2009, $99 million in
2008 and $69 million in 2007. Inflation on prescription inventory was 2.40% in
2009, 2.65% in 2008 and .71% in 2007. In all three fiscal years, we experienced
deflation in some non-prescription inventories.
Gross profit increased 5.8% in 2009 compared to increases of 9.2% in 2008 and
15.8% in 2007. The decrease in the rate of growth in the current year is due to
lower sales growth and lower front-end gross margins. The decrease in 2008 from
2007 was due to lower sales growth and lower gross profit contribution from
generic versions of the name brand drugs Zocor and Zoloft.
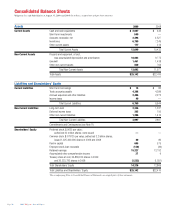
As of August 31, 2009, we have recorded the following balances within the
accrued expenses and other liabilities section of our Consolidated Balance Sheets
(In millions):
August 31, 2008 August 31, 2009
Reserve Balance Charges Cash Payments Reserve Balance
Severance and
other benefits $ — $82 $78 $4
We have realized savings related to these initiatives of approximately $250 million
for the year. The savings, which are included in selling, general and administrative
expenses, are primarily the result of reduced store labor and other position reductions.
We anticipate achieving net annual pre-tax savings of approximately $500 million
in fiscal 2010 and $1 billion by fiscal 2011 related to these initiatives.
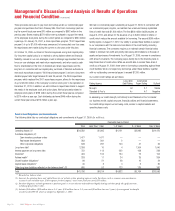
Operating Statistics
Percentage Increases/
(Decreases)
Fiscal Year 2009 2008 2007
Net Sales 7.3 9.8 13.4
Net Earnings (7.0) 5.7 16.6
Comparable Drugstore Sales 2.0 4.0 8.1
Prescription Sales 7.8 9.7 14.7
Comparable Drugstore Prescription Sales 3.5 3.9 9.5
Front-End Sales 6.3 10.0 12.2
Comparable Drugstore Front-End Sales (0.5) 4.2 5.8
Gross Profit 5.8 9.2 15.8
Selling, General and Administrative Expenses 8.8 9.2 15.5
Percent to Net Sales
Fiscal Year 2009 2008 2007
Gross Margin 27.8 28.2 28.4
Selling, General and Administrative Expenses 22.7 22.4 22.5
Other Statistics
Fiscal Year 2009 2008 2007
Prescription Sales as a % of Net Sales 65.3 64.9 65.0
Third-Party Sales as a % of Total Prescription Sales 95.4 95.3 94.8
Total Number of Prescriptions (In millions) 651 617 583
30-DayEquivalent Prescriptions (In millions) *723 677 636
Total Number of Locations 7,496 6,934 5,997
*Includes the adjustment to convert prescriptions greater than 84 days to the
equivalent of three 30-day prescriptions. This adjustment reflects the fact that these
prescriptions include approximately three times the amount of product days supplied
compared to a normal prescription.
Results of Operations
Fiscal year 2009 net earnings decreased 7.0% to $2,006 million, or $2.02 per share
(diluted), versus last year’s earnings of $2,157 million, or $2.17 per share (diluted).
The reduction in net earnings resulted from increased selling, general and adminis-
trative expenses thatincluded restructuring and restructuring related costs, reduced
gross margins and higher interest expense, which were partially offset by improved
sales. Additionally, the prior year was benefited by a positive adjustment of $79 million,
which corrected for historicallyover-accruing the Company’s vacation liability.
Net sales increased by7.3% to $63,335 million in fiscal 2009 compared to increases
of 9.8% in 2008 and 13.4% in 2007. Drugstore sales increases resulted from
sales gains in existing stores and added sales from new stores, each of which
2009 Walgreens Annual Report Page 19