Walgreens 2009 Annual Report Download - page 23
Download and view the complete annual report
Please find page 23 of the 2009 Walgreens annual report below. You can navigate through the pages in the report by either clicking on the pages listed below, or by using the keyword search tool below to find specific information within the annual report.-
 1
1 -
2
-
3
-
4
-
5
-
6
-
7
-
8
-
9
-
10
-
11
-
12
-
 13
13 -
 14
14 -
 15
15 -
 16
16 -
 17
17 -
 18
18 -
 19
19 -
 20
20 -
 21
21 -
 22
22 -
 23
23 -
 24
24 -
 25
25 -
 26
26 -
 27
27 -
 28
28 -
 29
29 -
 30
30 -
 31
31 -
 32
32 -
 33
33 -
34
-
35
-
36
-
37
-
38
-
39
-
40
-
41
-
42
 |
 |

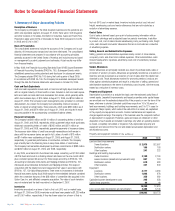
knowledge, we do not believe there is a reasonable likelihood that there will be a
material change in the estimates or assumptions used to determine the liability.
Liability for insurance claims – The liability for insurance claims is recorded based
on estimates for claims incurred and is not discounted. The provisions are estimated
in part by considering historical claims experience, demographic factors and other
actuarial assumptions. We have not made any material changes to the method of
estimating our liability for insurance claims during the last three years. Based on
current knowledge, we do not believe there is a reasonable likelihood that there will
be a material change in the estimates or assumptions used to determine the liability.
Cost of sales –Drugstore cost of sales is derived based on point-of-sale scanning
information with an estimate for shrinkage and adjusted based on periodic invento-
ries. Inventories are valued at the lower of cost or market determined by the last-in,
first-out (LIFO) method. We have not made any material changes to the method of
estimating cost of sales during the last three years. Based on current knowledge,
we do not believe there is a reasonable likelihood that there will be a material
change in the estimates or assumptions used to determine cost of sales.
Income taxes – Weare subject to routine income tax audits thatoccur periodically
in the normal course of business. U.S. federal, state and local and foreign tax
authorities raise questions regarding our tax filing positions, including the timing
and amount of deductions and the allocation of income among various tax jurisdic-
tions. In evaluating the tax benefits associated with our various tax filing positions,
we record a tax benefit for uncertain tax positions using the highest cumulative tax
benefit thatis more likelythan not to be realized. Adjustments are made to our
liability for unrecognized tax benefits in the period in which we determine the issue
is effectively settled with the tax authorities, the statute of limitations expires for
the return containing the tax position or when more information becomes available.
Our liability for unrecognized tax benefits, including accrued penalties and interest,
is included in other long-term liabilities on our consolidated balance sheets and in
income tax expense in our consolidated statements of earnings.
In determining our provision for income taxes, we use an annual effective income
tax rate based on full-year income, permanent differences between book and tax
income, and statutory income tax rates. The effective income tax rate also reflects
our assessment of the ultimate outcome of tax audits. Discrete events such as audit
settlements or changes in tax laws are recognized in the period in which they occur.
Weadopted the provisions of Financial Accounting Standards Board (FASB)
Interpretation No. (FIN) 48, Accounting for Uncertainty in Income Taxes – an
Interpretation of FASB Statement No. 109, effective September 1, 2007. The adoption
of FIN 48 resulted in the reclassification of certain tax liabilities from current to
long-term and a decrease in our liability for unrecognized tax benefits, which was
accounted for as an increase to the August 31, 2007, retained earnings balance.
Based on current knowledge, we do not believe there is a reasonable likelihood
that there will be a material change in the estimate or assumptions used to
determine income taxes.
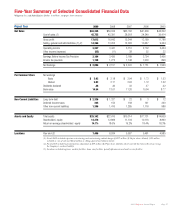
Liquidity and Capital Resources
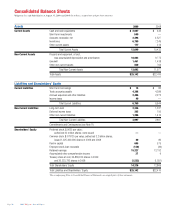
Cash and cash equivalents were $2,087 million at August 31, 2009, compared to
$443 million at August 31, 2008. Short-term investment objectives are to minimize
risk, maintain liquidity and maximize after-tax yields. To attain these objectives,
investment limits are placed on the amount, type and issuer of securities.
Investments are principally in U.S. Treasury market funds and Treasury Bills.
Net cash provided by operating activities improved $1,072 million to $4,111 million
compared to $3,039 million a year ago. The increase is primarily attributable to
working capital improvements. For the year, we generated $728 million in cash flow
from working capital improvements, primarily through better inventory management.
Working capital improvements were partially offset by lower net earnings. Last year,
working capital was a use of $87 million in cash. Cash provided by operations is
the principal source of funds for expansion, acquisitions, remodeling programs,
dividends to shareholders and stock repurchases. In fiscal 2009 and 2008, we
supplemented cash provided by operations with long-term debt.
Net cash used for investing activities was $2,776 million versus $2,818 million last
year. Using the proceeds from our issuance of long-term debt, we invested $2,600
million in short-term Treasury Bills, of which $500 million remained outstanding at
August 31, 2009. Additions to property and equipment were $1,927 million com-
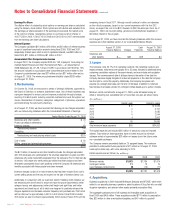
pared to $2,225 million last year. During the year, we added a total of 691 locations
(562 net) compared to 1,031 last year (937 net). There were 183 owned locations
added during the year and 42 under construction at August 31, 2009, versus 235
owned locations added and 69 under construction as of August 31, 2008.
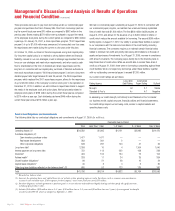
Work- Home Specialty Mail
Drugstores sites Care Pharmacy Service Total
August 31, 2007 5,882 3 101 8 3 5,997
New/Relocated 596 4 6 3 (1) 608
Acquired 32 362 27 2 — 423
Closed/Replaced (67) (5) (19) (3) — (94)
August 31, 2008 6,443 364 115 10 2 6,934
New/Relocated 556 36 5 5 — 602
Acquired 70 311 5—89
Closed/Replaced (72) (26) (26) (5) — (129)
August 31, 2009 6,997 377 105 15 2 7,496
Business acquisitions this year were $405 million versus $620 million in fiscal
2008. Business acquisitions in 2009 included select locations of Drug Fair to our
retail drugstore operations; McKesson Specialty and IVPCARE to our specialty
pharmacy operations; and selected other assets (primarily prescription files).
Business acquisitions in 2008 included the purchase of I-trax, Inc. and Whole
Health Management, operators of worksite health centers, including primary and
acute care, wellness, pharmacy and disease management services and health and
fitness programming; 20 drugstores from Farmacias El Amal; CuraScript Infusion
Pharmacy, Inc., a home infusion services provider; and selected other assets
(primarily prescription files).
Capital expenditures for fiscal 2010 are expected to be approximately $1.6 billion,
excluding business acquisitions and prescription file purchases. We expect new
drugstore organic growth of between 4.5% and 5.0% in fiscal 2010 and between
2.5% and 3.0% annually beginning in 2011. During the current fiscal year we
added a total of 691 locations, of which 626 were new, relocated or acquired
drugstores. We are continuing to relocate stores to more convenient and profitable
freestanding locations. In addition to new stores, expenditures are planned for
distribution centers and technology.
Net cash provided by financing activities was $309 million compared to a net cash
use of $33 million last year. On January 13, 2009, we issued $1,000 million of
5.25% notes due 2019. The notes were issued at a discount. The net proceeds
after deducting the discount, underwriting fees and issuance costs were $987 million.
2009 Walgreens Annual Report Page 21