AIG 2013 Annual Report Download - page 138
Download and view the complete annual report
Please find page 138 of the 2013 AIG annual report below. You can navigate through the pages in the report by either clicking on the pages listed below, or by using the keyword search tool below to find specific information within the annual report.-
 1
1 -
2
-
3
-
4
-
5
-
6
-
7
-
8
-
9
-
10
-
11
-
12
-
13
-
14
-
15
-
16
-
17
-
18
-
19
-
20
-
21
-
22
-
23
-
24
-
25
-
26
-
27
-
28
-
29
-
30
-
31
-
32
-
33
-
34
-
35
-
36
-
37
-
38
-
39
-
40
-
41
-
42
-
43
-
44
-
45
-
46
-
47
-
48
-
49
-
50
-
51
-
52
-
53
-
54
-
55
-
56
-
57
-
58
-
59
-
60
-
61
-
62
-
63
-
64
-
65
-
66
-
67
-
68
-
69
-
70
-
71
-
72
-
73
-
74
-
75
-
76
-
77
-
78
-
79
-
80
-
81
-
82
-
83
-
84
-
85
-
86
-
87
-
88
-
89
-
90
-
91
-
92
-
93
-
94
-
95
-
96
-
97
-
98
-
99
-
100
-
101
-
102
-
103
-
104
-
105
-
106
-
107
-
108
-
109
-
110
-
111
-
112
-
113
-
114
-
115
-
116
-
117
-
118
-
119
-
120
-
121
-
122
-
123
-
124
-
125
-
126
-
127
-
 128
128 -
 129
129 -
 130
130 -
 131
131 -
 132
132 -
 133
133 -
 134
134 -
 135
135 -
 136
136 -
 137
137 -
 138
138 -
 139
139 -
 140
140 -
 141
141 -
 142
142 -
 143
143 -
 144
144 -
 145
145 -
 146
146 -
 147
147 -
 148
148 -
149
-
150
-
151
-
152
-
153
-
154
-
155
-
156
-
157
-
158
-
159
-
160
-
161
-
162
-
163
-
164
-
165
-
166
-
167
-
168
-
169
-
170
-
171
-
172
-
173
-
174
-
175
-
176
-
177
-
178
-
179
-
180
-
181
-
182
-
183
-
184
-
185
-
186
-
187
-
188
-
189
-
190
-
191
-
192
-
193
-
194
-
195
-
196
-
197
-
198
-
199
-
200
-
201
-
202
-
203
-
204
-
205
-
206
-
207
-
208
-
209
-
210
-
211
-
212
-
213
-
214
-
215
-
216
-
217
-
218
-
219
-
220
-
221
-
222
-
223
-
224
-
225
-
226
-
227
-
228
-
229
-
230
-
231
-
232
-
233
-
234
-
235
-
236
-
237
-
238
-
239
-
240
-
241
-
242
-
243
-
244
-
245
-
246
-
247
-
248
-
249
-
250
-
251
-
252
-
253
-
254
-
255
-
256
-
257
-
258
-
259
-
260
-
261
-
262
-
263
-
264
-
265
-
266
-
267
-
268
-
269
-
270
-
271
-
272
-
273
-
274
-
275
-
276
-
277
-
278
-
279
-
280
-
281
-
282
-
283
-
284
-
285
-
286
-
287
-
288
-
289
-
290
-
291
-
292
-
293
-
294
-
295
-
296
-
297
-
298
-
299
-
300
-
301
-
302
-
303
-
304
-
305
-
306
-
307
-
308
-
309
-
310
-
311
-
312
-
313
-
314
-
315
-
316
-
317
-
318
-
319
-
320
-
321
-
322
-
323
-
324
-
325
-
326
-
327
-
328
-
329
-
330
-
331
-
332
-
333
-
334
-
335
-
336
-
337
-
338
-
339
-
340
-
341
-
342
-
343
-
344
-
345
-
346
-
347
-
348
-
349
-
350
-
351
-
352
-
353
-
354
-
355
-
356
-
357
-
358
-
359
-
360
-
361
-
362
-
363
-
364
-
365
-
366
-
367
-
368
-
369
-
370
-
371
-
372
-
373
-
374
-
375
-
376
-
377
-
378
-
379
-
380
-
381
-
382
-
383
-
384
-
385
-
386
-
387
-
388
-
389
-
390
 |
 |
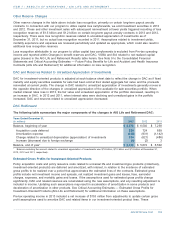
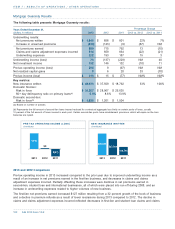
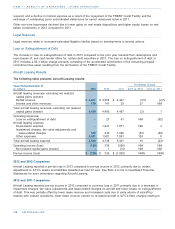
adjustments resulted from our comprehensive annual review and update of estimated gross profit assumptions, and
from a change in long-term asset growth rate assumptions for Group Retirement variable annuity products, which
was driven by sustained favorable equity market performance.
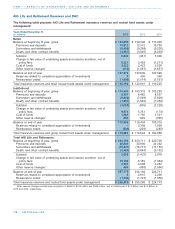
The result of the comprehensive annual review, which was completed in the third quarter of 2013, was a $118 million
net increase in Pre-tax operating income in 2013, which included a $198 million net increase in our Retail operating
segment and an $80 million decrease in our Institutional operating segment. The net increase in Retail pre-tax
operating income was primarily due to a favorable adjustment in our Fixed Annuities product line from updated
spread assumptions due to active management of crediting rates and higher future investment yields than those
previously assumed. In the Life Insurance and A&H, Retirement Income Solutions and Group Retirement product
lines, the update of assumptions for variable annuity spreads, surrender rates, and life insurance mortality had an
unfavorable impact on pre-tax operating income. The life insurance mortality assumptions, while unfavorable
compared to the previous assumption set, are still within pricing expectations.
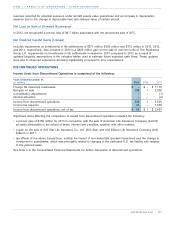
The $118 million increase in pre-tax operating income to reflect updated assumptions was comprised of a $98 million
net decrease in DAC amortization expense, a $61 million decrease in SIA amortization expense within Interest
credited to policyholder account balances, and a $28 million increase in unearned revenue amortization within Policy
fees, partially offset by a $69 million increase in Future policy benefits for life and health insurance contracts.
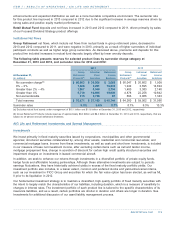
In estimating future gross profits for variable annuity products, a long-term annual asset growth assumption is applied
to estimate the future growth in assets and related asset-based fees. In determining the asset growth rate, the effect
of short-term fluctuations in the equity markets is partially mitigated through the use of a ‘‘reversion to the mean’’
methodology, whereby short-term asset growth above or below the long-term annual rate assumption will impact the
growth assumption applied to the five-year period subsequent to the current balance sheet date. In the fourth quarter
of 2013, we revised the growth rate assumptions for the five-year reversion to the mean period for the Group
Retirement product line in our Institutional segment. This adjustment, which increased DAC by $31 million, increased
SIA by $2 million and reduced the GMDB liability by $2 million, was recorded as a decrease in current period
amortization expense and increased our Retail pre-tax operating income by $35 million in 2013. For variable
annuities in our Retirement Income Solutions product line, the assumed annual growth rate remained above zero
percent for the five-year reversion to the mean period and therefore did not meet our criteria for adjustment;
however, additional favorable equity market performance in excess of long-term assumptions could result in
‘‘unlocking’’ in this product line in the future with a positive effect on pre-tax income in the period of the unlocking.
..................................................................................................................................................................................................................................
AIG 2013 Form 10-K120
ITEM 7 / RESULTS OF OPERATIONS / AIG LIFE AND RETIREMENT
..................................................................................................................................................................................