AIG 2013 Annual Report Download - page 171
Download and view the complete annual report
Please find page 171 of the 2013 AIG annual report below. You can navigate through the pages in the report by either clicking on the pages listed below, or by using the keyword search tool below to find specific information within the annual report.-
 1
1 -
2
-
3
-
4
-
5
-
6
-
7
-
8
-
9
-
10
-
11
-
12
-
13
-
14
-
15
-
16
-
17
-
18
-
19
-
20
-
21
-
22
-
23
-
24
-
25
-
26
-
27
-
28
-
29
-
30
-
31
-
32
-
33
-
34
-
35
-
36
-
37
-
38
-
39
-
40
-
41
-
42
-
43
-
44
-
45
-
46
-
47
-
48
-
49
-
50
-
51
-
52
-
53
-
54
-
55
-
56
-
57
-
58
-
59
-
60
-
61
-
62
-
63
-
64
-
65
-
66
-
67
-
68
-
69
-
70
-
71
-
72
-
73
-
74
-
75
-
76
-
77
-
78
-
79
-
80
-
81
-
82
-
83
-
84
-
85
-
86
-
87
-
88
-
89
-
90
-
91
-
92
-
93
-
94
-
95
-
96
-
97
-
98
-
99
-
100
-
101
-
102
-
103
-
104
-
105
-
106
-
107
-
108
-
109
-
110
-
111
-
112
-
113
-
114
-
115
-
116
-
117
-
118
-
119
-
120
-
121
-
122
-
123
-
124
-
125
-
126
-
127
-
128
-
129
-
130
-
131
-
132
-
133
-
134
-
135
-
136
-
137
-
138
-
139
-
140
-
141
-
142
-
143
-
144
-
145
-
146
-
147
-
148
-
149
-
150
-
151
-
152
-
153
-
154
-
155
-
156
-
157
-
158
-
159
-
160
-
 161
161 -
 162
162 -
 163
163 -
 164
164 -
 165
165 -
 166
166 -
 167
167 -
 168
168 -
 169
169 -
 170
170 -
 171
171 -
 172
172 -
 173
173 -
 174
174 -
 175
175 -
 176
176 -
 177
177 -
 178
178 -
 179
179 -
 180
180 -
 181
181 -
182
-
183
-
184
-
185
-
186
-
187
-
188
-
189
-
190
-
191
-
192
-
193
-
194
-
195
-
196
-
197
-
198
-
199
-
200
-
201
-
202
-
203
-
204
-
205
-
206
-
207
-
208
-
209
-
210
-
211
-
212
-
213
-
214
-
215
-
216
-
217
-
218
-
219
-
220
-
221
-
222
-
223
-
224
-
225
-
226
-
227
-
228
-
229
-
230
-
231
-
232
-
233
-
234
-
235
-
236
-
237
-
238
-
239
-
240
-
241
-
242
-
243
-
244
-
245
-
246
-
247
-
248
-
249
-
250
-
251
-
252
-
253
-
254
-
255
-
256
-
257
-
258
-
259
-
260
-
261
-
262
-
263
-
264
-
265
-
266
-
267
-
268
-
269
-
270
-
271
-
272
-
273
-
274
-
275
-
276
-
277
-
278
-
279
-
280
-
281
-
282
-
283
-
284
-
285
-
286
-
287
-
288
-
289
-
290
-
291
-
292
-
293
-
294
-
295
-
296
-
297
-
298
-
299
-
300
-
301
-
302
-
303
-
304
-
305
-
306
-
307
-
308
-
309
-
310
-
311
-
312
-
313
-
314
-
315
-
316
-
317
-
318
-
319
-
320
-
321
-
322
-
323
-
324
-
325
-
326
-
327
-
328
-
329
-
330
-
331
-
332
-
333
-
334
-
335
-
336
-
337
-
338
-
339
-
340
-
341
-
342
-
343
-
344
-
345
-
346
-
347
-
348
-
349
-
350
-
351
-
352
-
353
-
354
-
355
-
356
-
357
-
358
-
359
-
360
-
361
-
362
-
363
-
364
-
365
-
366
-
367
-
368
-
369
-
370
-
371
-
372
-
373
-
374
-
375
-
376
-
377
-
378
-
379
-
380
-
381
-
382
-
383
-
384
-
385
-
386
-
387
-
388
-
389
-
390
 |
 |
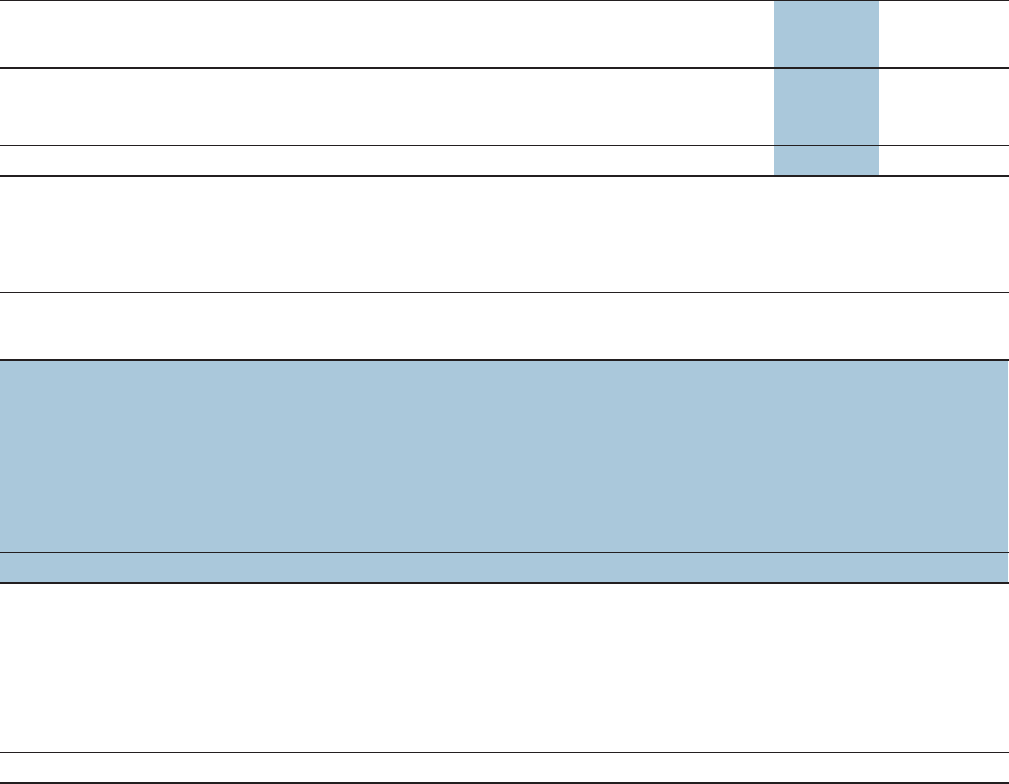
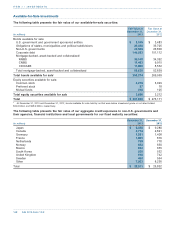
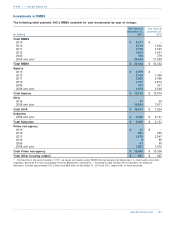
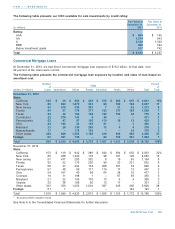
The following table presents our CMBS available for sale investments:
CMBS (traditional) $ 7,880
Agency 1,486
Other 549
Total*$ 9,915
* The increase in value is primarily attributable to net purchases of approximately $3.0 billion of highly rated CMBS securities, partially offset by
changes in net unrealized losses.
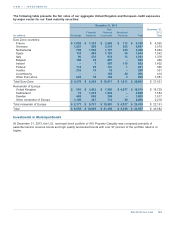
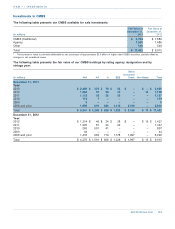
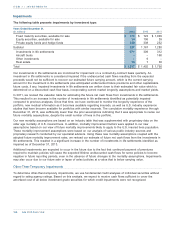
The following table presents the fair value of our CMBS holdings by rating agency designation and by
vintage year:
Year:
2013
2012
2011
2010
2009
2008 and prior
Total
December 31, 2012
Year:
2012 $ 1,314 $ 46 $ 24 $ 28 $ – $ 15 $ 1,427
2011 1,220 81 24 22 – – 1,347
2010 265 501 41 – – – 807
2009 44 – – – – – 44
2008 and prior 1,433 963 719 1,178 1,997 – 6,290
Total $ 4,276 $ 1,591 $ 808 $ 1,228 $ 1,997 $ 15 $ 9,915
Investments in CMBS
..................................................................................................................................................................................................................................
AIG 2013 Form 10-K 153
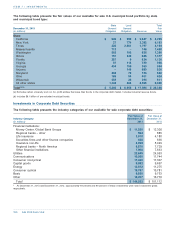
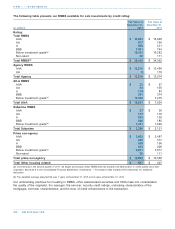
ITEM 7 / INVESTMENTS
Fair Value at Fair Value at
December 31, December 31,
(in millions) 2013 2012
$ 9,794
1,558
130
$ 11,482
Below
Investment
(in millions) AAA AA A BBB Grade Non-Rated Total
December 31, 2013
$ 2,490 $ 378 $ 79 $ 58 $ – $ – $ 3,005
1,064 57 26 35 – 14 1,196
1,112 19 36 20 – – 1,187
172 7 – – – – 179
5––– – – 5
1,098 819 688 1,115 2,190 – 5,910
$ 5,941 $ 1,280 $ 829 $ 1,228 $ 2,190 $ 14 $ 11,482
..................................................................................................................................................................................
............................................................................................................................................................................................