AIG 2013 Annual Report Download - page 297
Download and view the complete annual report
Please find page 297 of the 2013 AIG annual report below. You can navigate through the pages in the report by either clicking on the pages listed below, or by using the keyword search tool below to find specific information within the annual report.-
 1
1 -
2
-
3
-
4
-
5
-
6
-
7
-
8
-
9
-
10
-
11
-
12
-
13
-
14
-
15
-
16
-
17
-
18
-
19
-
20
-
21
-
22
-
23
-
24
-
25
-
26
-
27
-
28
-
29
-
30
-
31
-
32
-
33
-
34
-
35
-
36
-
37
-
38
-
39
-
40
-
41
-
42
-
43
-
44
-
45
-
46
-
47
-
48
-
49
-
50
-
51
-
52
-
53
-
54
-
55
-
56
-
57
-
58
-
59
-
60
-
61
-
62
-
63
-
64
-
65
-
66
-
67
-
68
-
69
-
70
-
71
-
72
-
73
-
74
-
75
-
76
-
77
-
78
-
79
-
80
-
81
-
82
-
83
-
84
-
85
-
86
-
87
-
88
-
89
-
90
-
91
-
92
-
93
-
94
-
95
-
96
-
97
-
98
-
99
-
100
-
101
-
102
-
103
-
104
-
105
-
106
-
107
-
108
-
109
-
110
-
111
-
112
-
113
-
114
-
115
-
116
-
117
-
118
-
119
-
120
-
121
-
122
-
123
-
124
-
125
-
126
-
127
-
128
-
129
-
130
-
131
-
132
-
133
-
134
-
135
-
136
-
137
-
138
-
139
-
140
-
141
-
142
-
143
-
144
-
145
-
146
-
147
-
148
-
149
-
150
-
151
-
152
-
153
-
154
-
155
-
156
-
157
-
158
-
159
-
160
-
161
-
162
-
163
-
164
-
165
-
166
-
167
-
168
-
169
-
170
-
171
-
172
-
173
-
174
-
175
-
176
-
177
-
178
-
179
-
180
-
181
-
182
-
183
-
184
-
185
-
186
-
187
-
188
-
189
-
190
-
191
-
192
-
193
-
194
-
195
-
196
-
197
-
198
-
199
-
200
-
201
-
202
-
203
-
204
-
205
-
206
-
207
-
208
-
209
-
210
-
211
-
212
-
213
-
214
-
215
-
216
-
217
-
218
-
219
-
220
-
221
-
222
-
223
-
224
-
225
-
226
-
227
-
228
-
229
-
230
-
231
-
232
-
233
-
234
-
235
-
236
-
237
-
238
-
239
-
240
-
241
-
242
-
243
-
244
-
245
-
246
-
247
-
248
-
249
-
250
-
251
-
252
-
253
-
254
-
255
-
256
-
257
-
258
-
259
-
260
-
261
-
262
-
263
-
264
-
265
-
266
-
267
-
268
-
269
-
270
-
271
-
272
-
273
-
274
-
275
-
276
-
277
-
278
-
279
-
280
-
281
-
282
-
283
-
284
-
285
-
286
-
 287
287 -
 288
288 -
 289
289 -
 290
290 -
 291
291 -
 292
292 -
 293
293 -
 294
294 -
 295
295 -
 296
296 -
 297
297 -
 298
298 -
 299
299 -
 300
300 -
 301
301 -
 302
302 -
 303
303 -
 304
304 -
 305
305 -
 306
306 -
 307
307 -
308
-
309
-
310
-
311
-
312
-
313
-
314
-
315
-
316
-
317
-
318
-
319
-
320
-
321
-
322
-
323
-
324
-
325
-
326
-
327
-
328
-
329
-
330
-
331
-
332
-
333
-
334
-
335
-
336
-
337
-
338
-
339
-
340
-
341
-
342
-
343
-
344
-
345
-
346
-
347
-
348
-
349
-
350
-
351
-
352
-
353
-
354
-
355
-
356
-
357
-
358
-
359
-
360
-
361
-
362
-
363
-
364
-
365
-
366
-
367
-
368
-
369
-
370
-
371
-
372
-
373
-
374
-
375
-
376
-
377
-
378
-
379
-
380
-
381
-
382
-
383
-
384
-
385
-
386
-
387
-
388
-
389
-
390
 |
 |
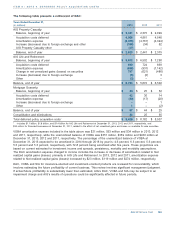
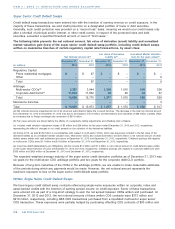
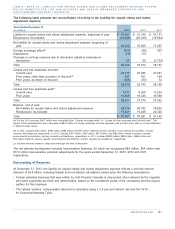
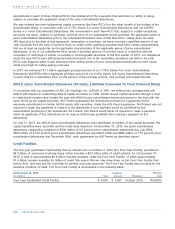
$51 million in net notional amounts at December 31, 2013 and 2012, respectively. The net unhedged positions of
$323 million and $359 million at December 31, 2013 and 2012, respectively, represent the maximum exposure to
loss on these CDS contracts. The average maturity of the written CDS contracts was three years and four years at
December 31, 2013 and 2012, respectively. At December 31, 2013 and 2012, the fair values of derivative liabilities
(which represents the carrying value) of the portfolio of CDS was $32 million and $48 million, respectively.
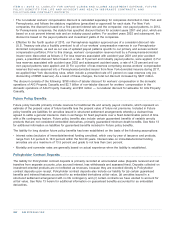
Upon a triggering event (e.g., a default) with respect to the underlying reference obligations, settlement is generally
effected through the payment of the notional amount of the contract to the counterparty in exchange for the related
principal amount of securities issued by the underlying credit obligor (physical settlement) or, in some cases,
payment of an amount associated with the value of the notional amount of the reference obligations through a market
quotation process (cash settlement).
These CDS contracts were written under ISDA Master Agreements. The majority of these ISDA Master Agreements
include credit support annexes (CSAs) that provide for collateral postings at various ratings and threshold levels. At
December 31, 2013 and 2012, net collateral posted by us under these contracts was $38 million and $64 million,
respectively, prior to offsets for other transactions.
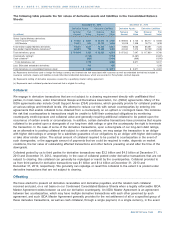
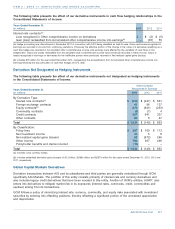
Our businesses, other than GCM, also use derivatives and other instruments as part of their financial risk
management. Interest rate derivatives (such as interest rate swaps) are used to manage interest rate risk associated
with embedded derivatives contained in insurance contract liabilities, fixed maturity securities, outstanding medium-
and long-term notes as well as other interest rate sensitive assets and liabilities. Foreign exchange derivatives
(principally foreign exchange forwards and options) are used to economically mitigate risk associated with non-U.S.
dollar denominated debt, net capital exposures, and foreign currency transactions. Equity derivatives are used to
mitigate financial risk embedded in certain insurance liabilities. The derivatives are effective economic hedges of the
exposures that they are meant to offset.
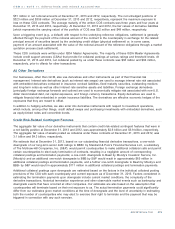
In addition to hedging activities, we also enter into derivative instruments with respect to investment operations,
which include, among other things, credit default swaps and purchasing investments with embedded derivatives, such
as equity-linked notes and convertible bonds.
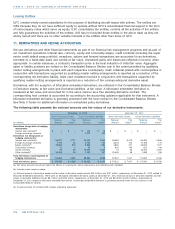
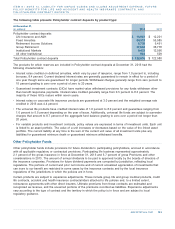
The aggregate fair value of our derivative instruments that contain credit risk-related contingent features that were in
a net liability position at December 31, 2013 and 2012, was approximately $2.6 billion and $3.9 billion, respectively.
The aggregate fair value of assets posted as collateral under these contracts at December 31, 2013 and 2012, was
3.1 billion and $4.3 billion, respectively.
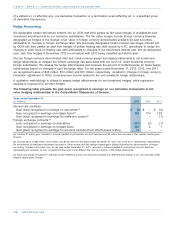
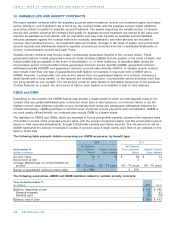
We estimate that at December 31, 2013, based on our outstanding financial derivative transactions, a one-notch
downgrade of our long-term senior debt ratings to BBB+ by Standard & Poor’s Financial Services LLC, a subsidiary
of The McGraw-Hill Companies, Inc. (S&P), would permit counterparties to make additional collateral calls and permit
certain counterparties to elect early termination of contracts, resulting in a negligible amount of corresponding
collateral postings and termination payments; a one-notch downgrade to Baa2 by Moody’s Investors’ Service, Inc.
(Moody’s) and an additional one-notch downgrade to BBB by S&P would result in approximately $65 million in
additional collateral postings and termination payments, and a further one-notch downgrade to Baa3 by Moody’s and
BBB- by S&P would result in approximately $111 million in additional collateral postings and termination payments.
Additional collateral postings upon downgrade are estimated based on the factors in the individual collateral posting
provisions of the CSA with each counterparty and current exposure as of December 31, 2013. Factors considered in
estimating the termination payments upon downgrade include current market conditions, the complexity of the
derivative transactions, historical termination experience and other observable market events such as bankruptcy and
downgrade events that have occurred at other companies. Our estimates are also based on the assumption that
counterparties will terminate based on their net exposure to us. The actual termination payments could significantly
differ from our estimates given market conditions at the time of downgrade and the level of uncertainty in estimating
both the number of counterparties who may elect to exercise their right to terminate and the payment that may be
triggered in connection with any such exercise.
All Other Derivatives
Credit Risk-Related Contingent Features
..................................................................................................................................................................................................................................
AIG 2013 Form 10-K 279
ITEM 8 / NOTE 11. DERIVATIVES AND HEDGE ACCOUNTING
..................................................................................................................................................................................
............................................................................................................................................................................................
............................................................................................................................................................................................