AIG 2013 Annual Report Download - page 255
Download and view the complete annual report
Please find page 255 of the 2013 AIG annual report below. You can navigate through the pages in the report by either clicking on the pages listed below, or by using the keyword search tool below to find specific information within the annual report.-
 1
1 -
2
-
3
-
4
-
5
-
6
-
7
-
8
-
9
-
10
-
11
-
12
-
13
-
14
-
15
-
16
-
17
-
18
-
19
-
20
-
21
-
22
-
23
-
24
-
25
-
26
-
27
-
28
-
29
-
30
-
31
-
32
-
33
-
34
-
35
-
36
-
37
-
38
-
39
-
40
-
41
-
42
-
43
-
44
-
45
-
46
-
47
-
48
-
49
-
50
-
51
-
52
-
53
-
54
-
55
-
56
-
57
-
58
-
59
-
60
-
61
-
62
-
63
-
64
-
65
-
66
-
67
-
68
-
69
-
70
-
71
-
72
-
73
-
74
-
75
-
76
-
77
-
78
-
79
-
80
-
81
-
82
-
83
-
84
-
85
-
86
-
87
-
88
-
89
-
90
-
91
-
92
-
93
-
94
-
95
-
96
-
97
-
98
-
99
-
100
-
101
-
102
-
103
-
104
-
105
-
106
-
107
-
108
-
109
-
110
-
111
-
112
-
113
-
114
-
115
-
116
-
117
-
118
-
119
-
120
-
121
-
122
-
123
-
124
-
125
-
126
-
127
-
128
-
129
-
130
-
131
-
132
-
133
-
134
-
135
-
136
-
137
-
138
-
139
-
140
-
141
-
142
-
143
-
144
-
145
-
146
-
147
-
148
-
149
-
150
-
151
-
152
-
153
-
154
-
155
-
156
-
157
-
158
-
159
-
160
-
161
-
162
-
163
-
164
-
165
-
166
-
167
-
168
-
169
-
170
-
171
-
172
-
173
-
174
-
175
-
176
-
177
-
178
-
179
-
180
-
181
-
182
-
183
-
184
-
185
-
186
-
187
-
188
-
189
-
190
-
191
-
192
-
193
-
194
-
195
-
196
-
197
-
198
-
199
-
200
-
201
-
202
-
203
-
204
-
205
-
206
-
207
-
208
-
209
-
210
-
211
-
212
-
213
-
214
-
215
-
216
-
217
-
218
-
219
-
220
-
221
-
222
-
223
-
224
-
225
-
226
-
227
-
228
-
229
-
230
-
231
-
232
-
233
-
234
-
235
-
236
-
237
-
238
-
239
-
240
-
241
-
242
-
243
-
244
-
 245
245 -
 246
246 -
 247
247 -
 248
248 -
 249
249 -
 250
250 -
 251
251 -
 252
252 -
 253
253 -
 254
254 -
 255
255 -
 256
256 -
 257
257 -
 258
258 -
 259
259 -
 260
260 -
 261
261 -
 262
262 -
 263
263 -
 264
264 -
 265
265 -
266
-
267
-
268
-
269
-
270
-
271
-
272
-
273
-
274
-
275
-
276
-
277
-
278
-
279
-
280
-
281
-
282
-
283
-
284
-
285
-
286
-
287
-
288
-
289
-
290
-
291
-
292
-
293
-
294
-
295
-
296
-
297
-
298
-
299
-
300
-
301
-
302
-
303
-
304
-
305
-
306
-
307
-
308
-
309
-
310
-
311
-
312
-
313
-
314
-
315
-
316
-
317
-
318
-
319
-
320
-
321
-
322
-
323
-
324
-
325
-
326
-
327
-
328
-
329
-
330
-
331
-
332
-
333
-
334
-
335
-
336
-
337
-
338
-
339
-
340
-
341
-
342
-
343
-
344
-
345
-
346
-
347
-
348
-
349
-
350
-
351
-
352
-
353
-
354
-
355
-
356
-
357
-
358
-
359
-
360
-
361
-
362
-
363
-
364
-
365
-
366
-
367
-
368
-
369
-
370
-
371
-
372
-
373
-
374
-
375
-
376
-
377
-
378
-
379
-
380
-
381
-
382
-
383
-
384
-
385
-
386
-
387
-
388
-
389
-
390
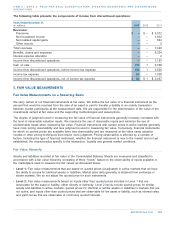
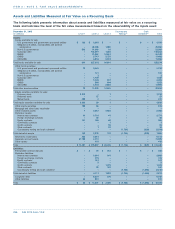
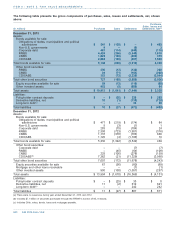
 |
 |

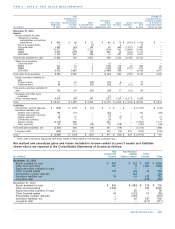
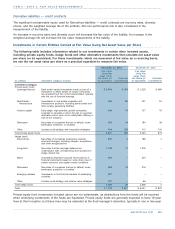
Assets:
Bonds available for sale:
U.S. government and government sponsored entities $ – $ 3,483 $ – $ – $ – $ 3,483
Obligations of states, municipalities and political subdivisions – 34,681 1,024 – – 35,705
Non-U.S. governments 1,004 25,782 14 – – 26,800
Corporate debt – 149,625 1,487 – – 151,112
RMBS – 22,730 11,662 – – 34,392
CMBS – 5,010 4,905 – – 9,915
CDO/ABS – 3,492 5,060 – – 8,552
Total bonds available for sale 1,004 244,803 24,152 – – 269,959
Other bond securities:
U.S. government and government sponsored entities 266 6,528 – – – 6,794
Non-U.S. governments – 2 – – – 2
Corporate debt – 1,320 – – – 1,320
RMBS – 1,331 396 – – 1,727
CMBS – 1,424 803 – – 2,227
CDO/ABS – 3,969 8,545 – – 12,514
Total other bond securities 266 14,574 9,744 – – 24,584
Equity securities available for sale:
Common stock 3,002 3 24 – – 3,029
Preferred stock – 34 44 – – 78
Mutual funds 83 22 – – – 105
Total equity securities available for sale 3,085 59 68 – – 3,212
Other equity securities 578 84 – – – 662
Mortgage and other loans receivable – 134 – – – 134
Other invested assets 125 1,542 5,389 – – 7,056
Derivative assets:
Interest rate contracts 2 5,521 956 – – 6,479
Foreign exchange contracts – 104 – – – 104
Equity contracts 104 63 54 – – 221
Commodity contracts – 144 1 – – 145
Credit contracts – – 60 – – 60
Other contracts – – 38 – – 38
Counterparty netting and cash collateral – – – (2,467) (909) (3,376)
Total derivative assets 106 5,832 1,109 (2,467) (909) 3,671
Short-term investments 285 7,771 – – – 8,056
Separate account assets 54,430 2,907 – – – 57,337
Other assets – 696 – – – 696
Total $ 59,879 $ 278,402 $ 40,462 $ (2,467) $ (909) $ 375,367
Liabilities:
Policyholder contract deposits $ – $ – $ 1,257 $ – $ – $ 1,257
Derivative liabilities:
Interest rate contracts – 5,582 224 – – 5,806
Foreign exchange contracts – 174 – – – 174
Equity contracts – 114 7 – – 121
Commodity contracts – 146 – – – 146
Credit contracts – – 2,051 – – 2,051
Other contracts – 6 200 – – 206
Counterparty netting and cash collateral – – – (2,467) (1,976) (4,443)
Total derivative liabilities – 6,022 2,482 (2,467) (1,976) 4,061
Long-term debt – 7,711 344 – – 8,055
Other liabilities 30 1,050 – – – 1,080
Total $ 30 $ 14,783 $ 4,083 $ (2,467) $ (1,976) $ 14,453
(a) Represents netting of derivative exposures covered by qualifying master netting agreements.
(b) Represents cash collateral posted and received. Securities collateral posted for derivative transactions that is reflected in Fixed maturity securities in the
Consolidated Balance Sheet, and collateral received, not reflected in the Consolidated Balance Sheet, was $1.3 billion and $120 million, respectively, at
December 31, 2013 and $1.9 billion and $299 million, respectively, at December 31, 2012.
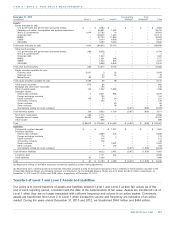
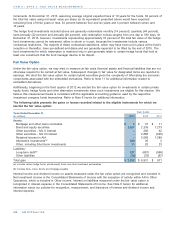
Our policy is to record transfers of assets and liabilities between Level 1 and Level 2 at their fair values as of the
end of each reporting period, consistent with the date of the determination of fair value. Assets are transferred out of
Level 1 when they are no longer transacted with sufficient frequency and volume in an active market. Conversely,
assets are transferred from Level 2 to Level 1 when transaction volume and frequency are indicative of an active
market. During the years ended December 31, 2013 and 2012, we transferred $944 million and $464 million,
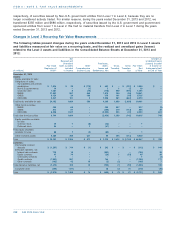
Transfers of Level 1 and Level 2 Assets and Liabilities
..................................................................................................................................................................................................................................
AIG 2013 Form 10-K 237
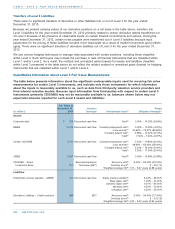
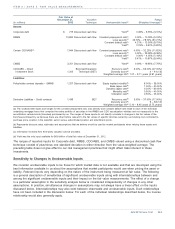
ITEM 8 / NOTE 5. FAIR VALUE MEASUREMENTS
December 31, 2012 Counterparty Cash
(in millions) Level 1 Level 2 Level 3 Netting(a) Collateral(b) Total
..................................................................................................................................................................................
............................................................................................................................................................................................