AIG 2013 Annual Report Download - page 170
Download and view the complete annual report
Please find page 170 of the 2013 AIG annual report below. You can navigate through the pages in the report by either clicking on the pages listed below, or by using the keyword search tool below to find specific information within the annual report.-
 1
1 -
2
-
3
-
4
-
5
-
6
-
7
-
8
-
9
-
10
-
11
-
12
-
13
-
14
-
15
-
16
-
17
-
18
-
19
-
20
-
21
-
22
-
23
-
24
-
25
-
26
-
27
-
28
-
29
-
30
-
31
-
32
-
33
-
34
-
35
-
36
-
37
-
38
-
39
-
40
-
41
-
42
-
43
-
44
-
45
-
46
-
47
-
48
-
49
-
50
-
51
-
52
-
53
-
54
-
55
-
56
-
57
-
58
-
59
-
60
-
61
-
62
-
63
-
64
-
65
-
66
-
67
-
68
-
69
-
70
-
71
-
72
-
73
-
74
-
75
-
76
-
77
-
78
-
79
-
80
-
81
-
82
-
83
-
84
-
85
-
86
-
87
-
88
-
89
-
90
-
91
-
92
-
93
-
94
-
95
-
96
-
97
-
98
-
99
-
100
-
101
-
102
-
103
-
104
-
105
-
106
-
107
-
108
-
109
-
110
-
111
-
112
-
113
-
114
-
115
-
116
-
117
-
118
-
119
-
120
-
121
-
122
-
123
-
124
-
125
-
126
-
127
-
128
-
129
-
130
-
131
-
132
-
133
-
134
-
135
-
136
-
137
-
138
-
139
-
140
-
141
-
142
-
143
-
144
-
145
-
146
-
147
-
148
-
149
-
150
-
151
-
152
-
153
-
154
-
155
-
156
-
157
-
158
-
159
-
 160
160 -
 161
161 -
 162
162 -
 163
163 -
 164
164 -
 165
165 -
 166
166 -
 167
167 -
 168
168 -
 169
169 -
 170
170 -
 171
171 -
 172
172 -
 173
173 -
 174
174 -
 175
175 -
 176
176 -
 177
177 -
 178
178 -
 179
179 -
 180
180 -
181
-
182
-
183
-
184
-
185
-
186
-
187
-
188
-
189
-
190
-
191
-
192
-
193
-
194
-
195
-
196
-
197
-
198
-
199
-
200
-
201
-
202
-
203
-
204
-
205
-
206
-
207
-
208
-
209
-
210
-
211
-
212
-
213
-
214
-
215
-
216
-
217
-
218
-
219
-
220
-
221
-
222
-
223
-
224
-
225
-
226
-
227
-
228
-
229
-
230
-
231
-
232
-
233
-
234
-
235
-
236
-
237
-
238
-
239
-
240
-
241
-
242
-
243
-
244
-
245
-
246
-
247
-
248
-
249
-
250
-
251
-
252
-
253
-
254
-
255
-
256
-
257
-
258
-
259
-
260
-
261
-
262
-
263
-
264
-
265
-
266
-
267
-
268
-
269
-
270
-
271
-
272
-
273
-
274
-
275
-
276
-
277
-
278
-
279
-
280
-
281
-
282
-
283
-
284
-
285
-
286
-
287
-
288
-
289
-
290
-
291
-
292
-
293
-
294
-
295
-
296
-
297
-
298
-
299
-
300
-
301
-
302
-
303
-
304
-
305
-
306
-
307
-
308
-
309
-
310
-
311
-
312
-
313
-
314
-
315
-
316
-
317
-
318
-
319
-
320
-
321
-
322
-
323
-
324
-
325
-
326
-
327
-
328
-
329
-
330
-
331
-
332
-
333
-
334
-
335
-
336
-
337
-
338
-
339
-
340
-
341
-
342
-
343
-
344
-
345
-
346
-
347
-
348
-
349
-
350
-
351
-
352
-
353
-
354
-
355
-
356
-
357
-
358
-
359
-
360
-
361
-
362
-
363
-
364
-
365
-
366
-
367
-
368
-
369
-
370
-
371
-
372
-
373
-
374
-
375
-
376
-
377
-
378
-
379
-
380
-
381
-
382
-
383
-
384
-
385
-
386
-
387
-
388
-
389
-
390
 |
 |
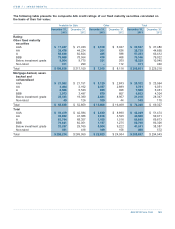
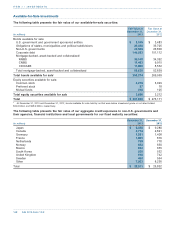
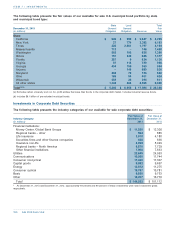
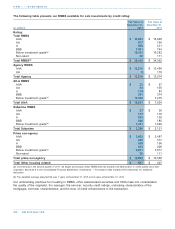
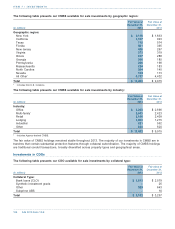
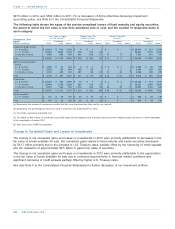
The following table presents our RMBS available for sale investments by credit rating:
Rating:
Total RMBS
AAA $ 16,048
AA 795
A 411
BBB 744
Below investment grade(a) 16,283
Non-rated 111
Total RMBS(b) $ 34,392
Agency RMBS
AAA $ 13,464
AA 110
Total Agency $ 13,574
Alt-A RMBS
AAA $57
AA 195
A 83
BBB 314
Below investment grade(a) 7,275
Total Alt-A $ 7,924
Subprime RMBS
AAA $38
AA 170
A 129
BBB 185
Below investment grade(a) 1,629
Total Subprime $ 2,151
Prime non-agency
AAA $ 2,487
AA 317
A 196
BBB 208
Below investment grade(a) 7,017
Non-rated 111
Total prime non-agency $ 10,336
Total Other housing related $ 407
(a) Commencing in the second quarter of 2011, we began purchasing certain RMBS that had experienced deterioration in credit quality since their
origination. See Note 6 to the Consolidated Financial Statements, Investments — Purchased Credit Impaired (PCI) Securities, for additional
discussion.
(b) The weighted average expected life was 7 years at December 31, 2013 and 6 years at December 31, 2012.
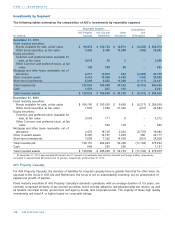
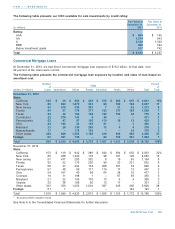
Our underwriting practices for investing in RMBS, other asset-backed securities and CDOs take into consideration
the quality of the originator, the manager, the servicer, security credit ratings, underlying characteristics of the
mortgages, borrower characteristics, and the level of credit enhancement in the transaction.
..................................................................................................................................................................................................................................
AIG 2013 Form 10-K152
ITEM 7 / INVESTMENTS
Fair Value at Fair Value at
December 31, December 31,
(in millions) 2013 2012
$ 14,833
477
598
1,051
19,163
26
$ 36,148
$ 12,210
6
$ 12,216
$32
54
114
381
10,350
$ 10,931
$27
117
233
248
1,761
$ 2,386
$ 2,462
288
248
383
6,651
26
$ 10,058
$ 557
..................................................................................................................................................................................