AIG 2013 Annual Report Download - page 272
Download and view the complete annual report
Please find page 272 of the 2013 AIG annual report below. You can navigate through the pages in the report by either clicking on the pages listed below, or by using the keyword search tool below to find specific information within the annual report.-
 1
1 -
2
-
3
-
4
-
5
-
6
-
7
-
8
-
9
-
10
-
11
-
12
-
13
-
14
-
15
-
16
-
17
-
18
-
19
-
20
-
21
-
22
-
23
-
24
-
25
-
26
-
27
-
28
-
29
-
30
-
31
-
32
-
33
-
34
-
35
-
36
-
37
-
38
-
39
-
40
-
41
-
42
-
43
-
44
-
45
-
46
-
47
-
48
-
49
-
50
-
51
-
52
-
53
-
54
-
55
-
56
-
57
-
58
-
59
-
60
-
61
-
62
-
63
-
64
-
65
-
66
-
67
-
68
-
69
-
70
-
71
-
72
-
73
-
74
-
75
-
76
-
77
-
78
-
79
-
80
-
81
-
82
-
83
-
84
-
85
-
86
-
87
-
88
-
89
-
90
-
91
-
92
-
93
-
94
-
95
-
96
-
97
-
98
-
99
-
100
-
101
-
102
-
103
-
104
-
105
-
106
-
107
-
108
-
109
-
110
-
111
-
112
-
113
-
114
-
115
-
116
-
117
-
118
-
119
-
120
-
121
-
122
-
123
-
124
-
125
-
126
-
127
-
128
-
129
-
130
-
131
-
132
-
133
-
134
-
135
-
136
-
137
-
138
-
139
-
140
-
141
-
142
-
143
-
144
-
145
-
146
-
147
-
148
-
149
-
150
-
151
-
152
-
153
-
154
-
155
-
156
-
157
-
158
-
159
-
160
-
161
-
162
-
163
-
164
-
165
-
166
-
167
-
168
-
169
-
170
-
171
-
172
-
173
-
174
-
175
-
176
-
177
-
178
-
179
-
180
-
181
-
182
-
183
-
184
-
185
-
186
-
187
-
188
-
189
-
190
-
191
-
192
-
193
-
194
-
195
-
196
-
197
-
198
-
199
-
200
-
201
-
202
-
203
-
204
-
205
-
206
-
207
-
208
-
209
-
210
-
211
-
212
-
213
-
214
-
215
-
216
-
217
-
218
-
219
-
220
-
221
-
222
-
223
-
224
-
225
-
226
-
227
-
228
-
229
-
230
-
231
-
232
-
233
-
234
-
235
-
236
-
237
-
238
-
239
-
240
-
241
-
242
-
243
-
244
-
245
-
246
-
247
-
248
-
249
-
250
-
251
-
252
-
253
-
254
-
255
-
256
-
257
-
258
-
259
-
260
-
261
-
 262
262 -
 263
263 -
 264
264 -
 265
265 -
 266
266 -
 267
267 -
 268
268 -
 269
269 -
 270
270 -
 271
271 -
 272
272 -
 273
273 -
 274
274 -
 275
275 -
 276
276 -
 277
277 -
 278
278 -
 279
279 -
 280
280 -
 281
281 -
 282
282 -
283
-
284
-
285
-
286
-
287
-
288
-
289
-
290
-
291
-
292
-
293
-
294
-
295
-
296
-
297
-
298
-
299
-
300
-
301
-
302
-
303
-
304
-
305
-
306
-
307
-
308
-
309
-
310
-
311
-
312
-
313
-
314
-
315
-
316
-
317
-
318
-
319
-
320
-
321
-
322
-
323
-
324
-
325
-
326
-
327
-
328
-
329
-
330
-
331
-
332
-
333
-
334
-
335
-
336
-
337
-
338
-
339
-
340
-
341
-
342
-
343
-
344
-
345
-
346
-
347
-
348
-
349
-
350
-
351
-
352
-
353
-
354
-
355
-
356
-
357
-
358
-
359
-
360
-
361
-
362
-
363
-
364
-
365
-
366
-
367
-
368
-
369
-
370
-
371
-
372
-
373
-
374
-
375
-
376
-
377
-
378
-
379
-
380
-
381
-
382
-
383
-
384
-
385
-
386
-
387
-
388
-
389
-
390
 |
 |

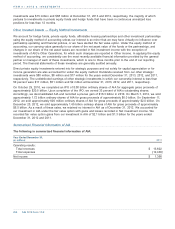
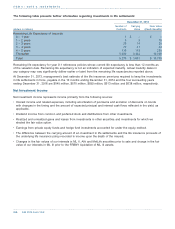
investments was $15 million and $68 million at December 31, 2013 and 2012, respectively, the majority of which
pertains to investments in private equity funds and hedge funds that have been in continuous unrealized loss
positions for less than 12 months.
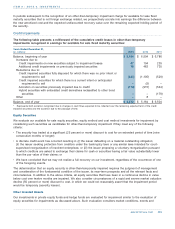
We account for hedge funds, private equity funds, affordable housing partnerships and other investment partnerships
using the equity method of accounting unless our interest is so minor that we may have virtually no influence over
partnership operating and financial policies, or we have elected the fair value option. Under the equity method of
accounting, our carrying value generally is our share of the net asset value of the funds or the partnerships, and
changes in our share of the net asset values are recorded in Net investment income with the exception of
investments of AIG’s Other Operations, for which such changes are reported in Other income. In applying the equity
method of accounting, we consistently use the most recently available financial information provided by the general
partner or manager of each of these investments, which is one to three months prior to the end of our reporting
period. The financial statements of these investees are generally audited annually.
Direct private equity investments entered into for strategic purposes and not solely for capital appreciation or for
income generation are also accounted for under the equity method. Dividends received from our other strategic
investments were $80 million, $8 million and $17 million for the years ended December 31, 2013, 2012, and 2011,
respectively. The undistributed earnings of other strategic investments in which our ownership interest is less than
50 percent were $17 million, $51 million and $9 million at December 31, 2013, 2012, and 2011, respectively.
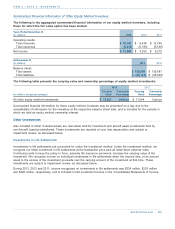
On October 29, 2010, we completed an IPO of 8.08 billion ordinary shares of AIA for aggregate gross proceeds of
approximately $20.5 billion. Upon completion of the IPO, we owned 33 percent of AIA’s outstanding shares.
Accordingly, we deconsolidated AIA and recorded a pre-tax gain of $16.3 billion in 2010. On March 7, 2012, we sold
approximately 1.72 billion ordinary shares of AIA for gross proceeds of approximately $6.0 billion. On September 11,
2012, we sold approximately 600 million ordinary shares of AIA for gross proceeds of approximately $2.0 billion. On
December 20, 2012, we sold approximately 1.65 billion ordinary shares of AIA for gross proceeds of approximately
$6.5 billion. As a result of these sales, we retained no interest in AIA as of December 31, 2012. We accounted for
our investment in AIA under the fair value option with gains and losses recorded in Net investment income. We
recorded fair value option gains from our investment in AIA of $2.1 billion and $1.3 billion for the years ended
December 31, 2012 and 2011.
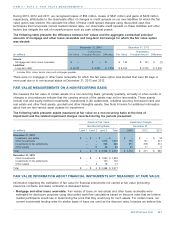
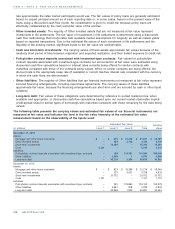
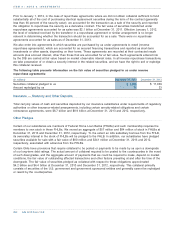
The following is summarized financial information of AIA:
Operating results:
Total revenues $ 13,802
Total expenses (12,436)
Net income $ 1,366
Other Invested Assets — Equity Method Investments
Summarized Financial Information of AIA
..................................................................................................................................................................................................................................
AIG 2013 Form 10-K254
ITEM 8 / NOTE 6. INVESTMENTS
Year Ended December 31,
(in millions) 2011
..................................................................................................................................................................................
............................................................................................................................................................................................
............................................................................................................................................................................................