Big Lots 2015 Annual Report Download - page 103
Download and view the complete annual report
Please find page 103 of the 2015 Big Lots annual report below. You can navigate through the pages in the report by either clicking on the pages listed below, or by using the keyword search tool below to find specific information within the annual report.-
 1
1 -
2
-
3
-
4
-
5
-
6
-
7
-
8
-
9
-
10
-
11
-
12
-
13
-
14
-
15
-
16
-
17
-
18
-
19
-
20
-
21
-
22
-
23
-
24
-
25
-
26
-
27
-
28
-
29
-
30
-
31
-
32
-
33
-
34
-
35
-
36
-
37
-
38
-
39
-
40
-
41
-
42
-
43
-
44
-
45
-
46
-
47
-
48
-
49
-
50
-
51
-
52
-
53
-
54
-
55
-
56
-
57
-
58
-
59
-
60
-
61
-
62
-
63
-
64
-
65
-
66
-
67
-
68
-
69
-
70
-
71
-
72
-
73
-
74
-
75
-
76
-
77
-
78
-
79
-
80
-
81
-
82
-
83
-
84
-
85
-
86
-
87
-
88
-
89
-
90
-
91
-
92
-
 93
93 -
 94
94 -
 95
95 -
 96
96 -
 97
97 -
 98
98 -
 99
99 -
 100
100 -
 101
101 -
 102
102 -
 103
103 -
 104
104 -
 105
105 -
 106
106 -
 107
107 -
 108
108 -
 109
109 -
 110
110 -
 111
111 -
 112
112 -
 113
113 -
114
-
115
-
116
-
117
-
118
-
119
-
120
-
121
-
122
-
123
-
124
-
125
-
126
-
127
-
128
-
129
-
130
-
131
-
132
-
133
-
134
-
135
-
136
-
137
-
138
-
139
-
140
-
141
-
142
-
143
-
144
-
145
-
146
-
147
-
148
-
149
-
150
-
151
-
152
-
153
-
154
-
155
-
156
-
157
-
158
-
159
-
160
-
161
-
162
-
163
-
164
-
165
-
166
 |
 |
26
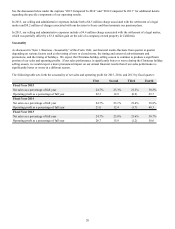
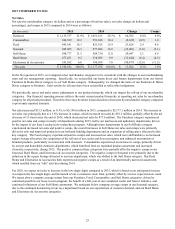
Gross Margin
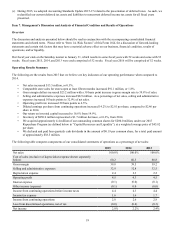
Gross margin dollars increased $23.2 million, or 1.1%, to $2,067.2 million in 2015, compared to $2,044.0 million in 2014. The
increase in gross margin dollars was principally due to a higher gross margin rate, which increased gross margin dollars by
approximately $17.9 million along with an increase in net sales, which increased gross margin dollars by approximately $5.3
million. Gross margin as a percentage of net sales increased 30 basis points to 39.8% in 2015 compared to 39.5% in 2014. The
gross margin rate increase was principally due to improvements in initial markup and a lower overall markdown rate in 2015 as
compared to 2014, due to the significant markdowns taken in 2014 as part of our Edit to Amplify merchandise strategy to sell
through and narrow our assortment in certain underperforming categories in the first quarter of 2014.
For 2016, we expect our gross margin rate to be slightly higher than 2015, as we anticipate a slightly higher initial mark-up on
our merchandise, driven by favorable freight costs, and a slightly lower markdown rate.
Selling and Administrative Expenses
Selling and administrative expenses were $1,708.7 million in 2015, compared to $1,699.8 million in 2014. The increase of
$8.9 million, or 0.5%, was primarily due to pension termination related expenses of $9.2 million, a $4.5 million loss
contingency associated with a merchandise-related legal matter during the second quarter of 2015, along with increases in
corporate office payroll and severance related expense of $5.5 million, accrued bonus expense of $4.5 million, and share-based
compensation of $2.9 million. These increases were partially offset by a decrease in store related payroll of $9.4 million.
During the third and fourth quarters of 2015, we amended our Pension Plan and Supplemental Pension Plan, respectively, to
freeze benefits and terminate the plans, and as a result, we incurred curtailments, while also incurring settlement charges, which
totaled approximately $2.2 million. Additionally, when we announced the plan terminations to active plan participants, we
communicated to them a one-time conversion benefit, for which we accrued $7.0 million. The increase in corporate office
payroll expenses was primarily driven by annual merit increases and severance related expenses combined with our investment
in hiring for our e-commerce support functions, including information technology and marketing team members. The increase
in accrued bonus expense was directly related to better financial performance in 2015 relative to our quarterly and annual
operating plans as compared to our performance during 2014. The increase in share-based compensation expense was
primarily driven by the lack of forfeiture of awards, and the related expense reversal, by individuals affected by separation
activities in 2015 when compared to 2014. The decrease in store-related payroll resulted principally from a net decrease of 11
stores compared to the end of 2014.
As a percentage of net sales, selling and administrative expenses increased by 10 basis points to 32.9% in 2015 compared to
32.8% in 2014. Our future selling and administrative expense as a percentage of net sales depends on many factors, including
our level of net sales, our ability to implement additional efficiencies, principally in our store and distribution center operations,
and fluctuating commodity prices, such as diesel fuel, which directly affects our outbound transportation cost.
For 2016, we are forecasting an expense rate slightly lower than the rate achieved in 2015. Store expenses, distribution and
transportation expenses, and advertising costs are expected to leverage as comparable store sales are expected to grow at a
faster rate than expense growth. These leveraged expenses are expected to be partially offset by an increase in our share-based
compensation expense, primarily related to performance share units (“PSUs”), and certain operational investments and
expenses related to our e-commerce activities. Our forecasted expense rate excludes the impact of the expenses associated with
the termination of our Pension Plan and Supplemental Pension Plan, which are estimated to be approximately $15 million (after
tax) that may be incurred in either 2016 or 2017.
Depreciation Expense
Depreciation expense increased $3.0 million to $122.7 million in 2015 compared to $119.7 million in 2014. The increase was
directly related to our continued investment in systems and capital spending to support and maintain our stores, including the
completion of the roll-out of our cooler and freezer program and our POS systems upgrade, and projects at our distribution
centers. Depreciation expense as a percentage of net sales increased by 10 basis points compared to 2014.
For 2016, we expect capital expenditures of approximately $105 million to $110 million, which includes maintenance capital
for our stores, distribution centers, and corporate offices, the construction costs associated with opening 15 new stores and
investments in strategic initiatives to support future growth. Using this assumption and the run rate of depreciation on our
existing property and equipment, we expect 2016 depreciation expense to be approximately $125 million to $130 million,
which would represent an increase from 2015.