Big Lots 2015 Annual Report Download - page 140
Download and view the complete annual report
Please find page 140 of the 2015 Big Lots annual report below. You can navigate through the pages in the report by either clicking on the pages listed below, or by using the keyword search tool below to find specific information within the annual report.-
 1
1 -
2
-
3
-
4
-
5
-
6
-
7
-
8
-
9
-
10
-
11
-
12
-
13
-
14
-
15
-
16
-
17
-
18
-
19
-
20
-
21
-
22
-
23
-
24
-
25
-
26
-
27
-
28
-
29
-
30
-
31
-
32
-
33
-
34
-
35
-
36
-
37
-
38
-
39
-
40
-
41
-
42
-
43
-
44
-
45
-
46
-
47
-
48
-
49
-
50
-
51
-
52
-
53
-
54
-
55
-
56
-
57
-
58
-
59
-
60
-
61
-
62
-
63
-
64
-
65
-
66
-
67
-
68
-
69
-
70
-
71
-
72
-
73
-
74
-
75
-
76
-
77
-
78
-
79
-
80
-
81
-
82
-
83
-
84
-
85
-
86
-
87
-
88
-
89
-
90
-
91
-
92
-
93
-
94
-
95
-
96
-
97
-
98
-
99
-
100
-
101
-
102
-
103
-
104
-
105
-
106
-
107
-
108
-
109
-
110
-
111
-
112
-
113
-
114
-
115
-
116
-
117
-
118
-
119
-
120
-
121
-
122
-
123
-
124
-
125
-
126
-
127
-
128
-
129
-
 130
130 -
 131
131 -
 132
132 -
 133
133 -
 134
134 -
 135
135 -
 136
136 -
 137
137 -
 138
138 -
 139
139 -
 140
140 -
 141
141 -
 142
142 -
 143
143 -
 144
144 -
 145
145 -
 146
146 -
 147
147 -
 148
148 -
 149
149 -
 150
150 -
151
-
152
-
153
-
154
-
155
-
156
-
157
-
158
-
159
-
160
-
161
-
162
-
163
-
164
-
165
-
166
 |
 |

63
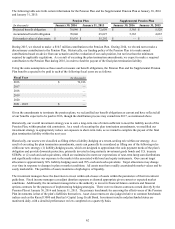
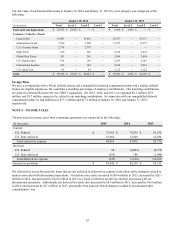
The fair value of our Pension Plan assets at January 30, 2016 and January 31, 2015 by asset category was comprised of the
following:
January 30, 2016 January 31, 2015
(In thousands) Total Level 1 Level 2 Level 3 Total Level 1 Level 2 Level 3
Cash and Cash Equivalents $ 25,035 $ 25,035 $ — $ — $ 1,096 $ 1,096 $ — $ —
Common / Collective Trusts
Long Credit 19,463 — 19,463 — 25,317 — 25,317 —
Intermediate Credit 7,380 — 7,380 — 17,972 — 17,972 —
U.S. Treasury Strips 2,778 — 2,778 — ————
High Yield 266 — 266 — 2,674 — 2,674 —
Global Real Estate 241 — 241 — 2,894 — 2,894 —
U.S. Equity Index 196 — 196 — 2,183 — 2,183 —
International Equities 182 — 182 — 2,034 — 2,034 —
U.S. Small Cap 95 — 95 — 1,122 — 1,122 —
Total $ 55,636 $ 25,035 $ 30,601 $ — $ 55,292 $ 1,096 $ 54,196 $ —
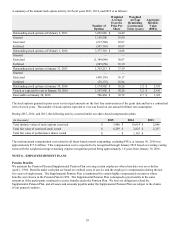
Savings Plans
We have a savings plan with a 401(k) deferral feature and a nonqualified deferred compensation plan with a similar deferral
feature for eligible employees. We contribute a matching percentage of employee contributions. Our matching contributions
are subject to Internal Revenue Service (“IRS”) regulations. For 2015, 2014, and 2013, we expensed $6.3 million, $5.9
million, and $5.7 million, respectively, related to our matching contributions. In connection with our nonqualified deferred
compensation plan, we had liabilities of $17.5 million and $17.2 million at January 30, 2016 and January 31, 2015,
respectively.
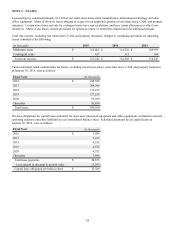
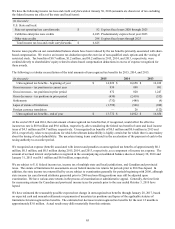
NOTE 9 – INCOME TAXES
The provision for income taxes from continuing operations was comprised of the following:
(In thousands) 2015 2014 2013
Current:
U.S. Federal $ 73,421 $ 74,235 $ 81,270
U.S. State and local 10,660 12,840 14,506
Total current tax expense 84,081 87,075 95,776
Deferred:
U.S. Federal 56 (2,022)(8,275)
U.S. State and local (295) 186 (1,986)
Total deferred tax expense (239)(1,836)(10,261)
Income tax provision $ 83,842 $ 85,239 $ 85,515
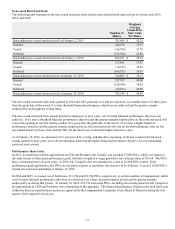
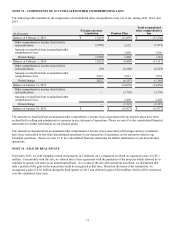
Net deferred tax assets fluctuated by items that are not reflected in deferred tax expense in the above table, primarily related to
matters associated with discontinued operations. Net deferred tax assets increased by $0.4 million in 2015, decreased by $24.3
million in 2014, and increased by $22.0 million in 2013 as a result of deferred income tax expense associated with our
discontinued operations. Additionally, net deferred tax assets also increased by $0.8 million in 2015, increased by $4.0 million
in 2014, and decreased by $2.3 million in 2013, principally from pension-related charges recorded in accumulated other
comprehensive loss.