Big Lots 2015 Annual Report Download - page 141
Download and view the complete annual report
Please find page 141 of the 2015 Big Lots annual report below. You can navigate through the pages in the report by either clicking on the pages listed below, or by using the keyword search tool below to find specific information within the annual report.-
 1
1 -
2
-
3
-
4
-
5
-
6
-
7
-
8
-
9
-
10
-
11
-
12
-
13
-
14
-
15
-
16
-
17
-
18
-
19
-
20
-
21
-
22
-
23
-
24
-
25
-
26
-
27
-
28
-
29
-
30
-
31
-
32
-
33
-
34
-
35
-
36
-
37
-
38
-
39
-
40
-
41
-
42
-
43
-
44
-
45
-
46
-
47
-
48
-
49
-
50
-
51
-
52
-
53
-
54
-
55
-
56
-
57
-
58
-
59
-
60
-
61
-
62
-
63
-
64
-
65
-
66
-
67
-
68
-
69
-
70
-
71
-
72
-
73
-
74
-
75
-
76
-
77
-
78
-
79
-
80
-
81
-
82
-
83
-
84
-
85
-
86
-
87
-
88
-
89
-
90
-
91
-
92
-
93
-
94
-
95
-
96
-
97
-
98
-
99
-
100
-
101
-
102
-
103
-
104
-
105
-
106
-
107
-
108
-
109
-
110
-
111
-
112
-
113
-
114
-
115
-
116
-
117
-
118
-
119
-
120
-
121
-
122
-
123
-
124
-
125
-
126
-
127
-
128
-
129
-
130
-
 131
131 -
 132
132 -
 133
133 -
 134
134 -
 135
135 -
 136
136 -
 137
137 -
 138
138 -
 139
139 -
 140
140 -
 141
141 -
 142
142 -
 143
143 -
 144
144 -
 145
145 -
 146
146 -
 147
147 -
 148
148 -
 149
149 -
 150
150 -
 151
151 -
152
-
153
-
154
-
155
-
156
-
157
-
158
-
159
-
160
-
161
-
162
-
163
-
164
-
165
-
166
 |
 |

64
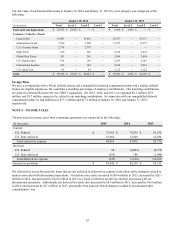
Reconciliation between the statutory federal income tax rate and the effective income tax rate for continuing operations was as
follows:
2015 2014 2013
Statutory federal income tax rate 35.0% 35.0% 35.0%
Effect of:
State and local income taxes, net of federal tax benefit 3.0 3.8 3.6
Work opportunity tax and other employment tax credits (1.1)(0.7)(1.0)
Valuation allowance — — —
Other, net 0.1 0.3 0.1
Effective income tax rate 37.0% 38.4% 37.7%
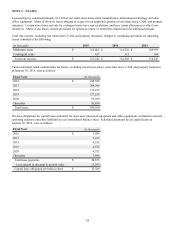
Income tax payments and refunds were as follows:
(In thousands) 2015 2014 2013
Income taxes paid $ 56,158 $ 69,919 $ 122,672
Income taxes refunded (818)(135)(551)
Net income taxes paid $ 55,340 $ 69,784 $ 122,121
Deferred taxes reflect the net tax effects of temporary differences between carrying amounts of assets and liabilities for
financial reporting purposes and the amounts used for income tax, including income tax uncertainties. Significant components
of our deferred tax assets and liabilities were as follows:
(In thousands) January 30, 2016 January 31, 2015
Deferred tax assets:
Workers’ compensation and other insurance reserves $ 33,531 $ 32,242
Compensation related 31,478 28,047
Accrued rent 23,540 26,283
Uniform inventory capitalization 18,488 17,649
Depreciation and fixed asset basis differences 10,523 9,972
Pension plans 7,815 9,086
Accrued state taxes 7,119 6,869
State tax credits, net of federal tax benefit 4,253 4,048
Accrued operating liabilities 2,189 1,751
Other 19,775 20,099
Valuation allowances (2,419)(2,373)
Total deferred tax assets 156,292 153,673
Deferred tax liabilities:
Accelerated depreciation and fixed asset basis differences 70,698 67,299
Lease construction reimbursements 15,602 15,317
Prepaid expenses 6,625 6,247
Workers’ compensation and other insurance reserves 4,329 4,203
Other 11,299 14,314
Total deferred tax liabilities 108,553 107,380
Net deferred tax assets $ 47,739 $ 46,293