Big Lots 2015 Annual Report Download - page 68
Download and view the complete annual report
Please find page 68 of the 2015 Big Lots annual report below. You can navigate through the pages in the report by either clicking on the pages listed below, or by using the keyword search tool below to find specific information within the annual report.-
 1
1 -
2
-
3
-
4
-
5
-
6
-
7
-
8
-
9
-
10
-
11
-
12
-
13
-
14
-
15
-
16
-
17
-
18
-
19
-
20
-
21
-
22
-
23
-
24
-
25
-
26
-
27
-
28
-
29
-
30
-
31
-
32
-
33
-
34
-
35
-
36
-
37
-
38
-
39
-
40
-
41
-
42
-
43
-
44
-
45
-
46
-
47
-
48
-
49
-
50
-
51
-
52
-
53
-
54
-
55
-
56
-
57
-
 58
58 -
 59
59 -
 60
60 -
 61
61 -
 62
62 -
 63
63 -
 64
64 -
 65
65 -
 66
66 -
 67
67 -
 68
68 -
 69
69 -
 70
70 -
 71
71 -
 72
72 -
 73
73 -
 74
74 -
 75
75 -
 76
76 -
 77
77 -
 78
78 -
79
-
80
-
81
-
82
-
83
-
84
-
85
-
86
-
87
-
88
-
89
-
90
-
91
-
92
-
93
-
94
-
95
-
96
-
97
-
98
-
99
-
100
-
101
-
102
-
103
-
104
-
105
-
106
-
107
-
108
-
109
-
110
-
111
-
112
-
113
-
114
-
115
-
116
-
117
-
118
-
119
-
120
-
121
-
122
-
123
-
124
-
125
-
126
-
127
-
128
-
129
-
130
-
131
-
132
-
133
-
134
-
135
-
136
-
137
-
138
-
139
-
140
-
141
-
142
-
143
-
144
-
145
-
146
-
147
-
148
-
149
-
150
-
151
-
152
-
153
-
154
-
155
-
156
-
157
-
158
-
159
-
160
-
161
-
162
-
163
-
164
-
165
-
166
 |
 |

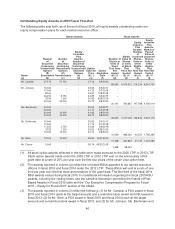
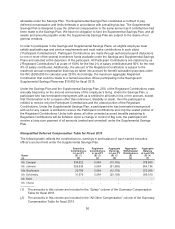
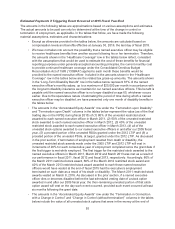
fiscal 2015 (i.e., the closing market price of our common shares on the final trading day of fiscal
2015 less the applicable exercise price) and all unvested restricted stock, RSUs and PSUs that
would have vested on an accelerated basis had a change in control occurred as of the end of
fiscal 2015. These amounts do not reflect any equity awards that vested in fiscal 2015.
• The closing market price of our common shares on the final trading day on the NYSE during
fiscal 2015 was $38.78 per share.
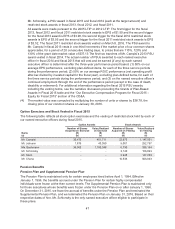
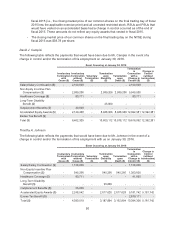
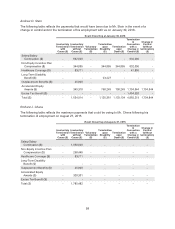
David J. Campisi
The following table reflects the payments that would have been due to Mr. Campisi in the event of a
change in control and/or the termination of his employment on January 30, 2016.
Event Occurring at January 30, 2016
Involuntary
Termination
with
Cause ($)
Involuntary
Termination
without
Cause ($)
Voluntary
Termination
($)
Termination
upon
Disability
($)
Termination
upon
Death ($)
Termination
in
Connection
with a
Change in
Control ($)
Change in
Control
(without
termination)
($)
Salary/Salary Continuation ($) - 2,100,000 - - - 2,100,000 -
Non-Equity Incentive Plan
Compensation ($) - 2,089,206 - 2,089,206 2,089,206 5,040,000 -
Healthcare Coverage ($) - 83,711 - - - 83,711 -
Long-Term Disability
Benefit ($) - - - 25,000 - - -
Outplacement Benefits ($) - 40,000 - - - - -
Accelerated Equity Awards ($) - 2,149,408 - 8,488,906 8,488,906 12,392,381 12,392,381
Excise Tax Benefit ($) - - - - - - -
Total ($) - 6,462,325 - 10,603,112 10,578,112 19,616,092 12,392,381
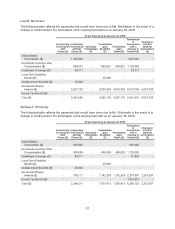
Timothy A. Johnson
The following table reflects the payments that would have been due to Mr. Johnson in the event of a
change in control and/or the termination of his employment with us on January 30, 2016.
Event Occurring at January 30, 2016
Involuntary
Termination
with
Cause ($)
Involuntary
Termination
without
Cause ($)
Voluntary
Termination
($)
Termination
upon
Disability
($)
Termination
upon
Death ($)
Termination
in
Connection
with a
Change in
Control ($)
Change in
Control
(without
termination)
($)
Salary/Salary Continuation ($) - 1,128,000 - - - 1,128,000 -
Non-Equity Incentive Plan
Compensation ($) - 545,266 - 545,266 545,266 1,353,600 -
Healthcare Coverage ($) - 83,711 - - - 41,855 -
Long-Term Disability
Benefit ($) - - - 25,000 - - -
Outplacement Benefits ($) - 25,000 - - - - -
Accelerated Equity Awards ($) - 2,248,542 - 2,617,628 2,617,628 5,181,742 5,181,742
Excise Tax Benefit ($) - - - - - 2,679,111 -
Total ($) - 4,030,519 - 3,187,894 3,162,894 10,384,308 5,181,742
56